Kenya county carbon atlas
Above-ground carbon for all 47 counties, from one Carbon-Eye analysis of the whole country, run on 2026-11-18. Open a county for its numbers, or see how they are made. The whole set is also out as an open data release: State of Kenya's carbon 2026.
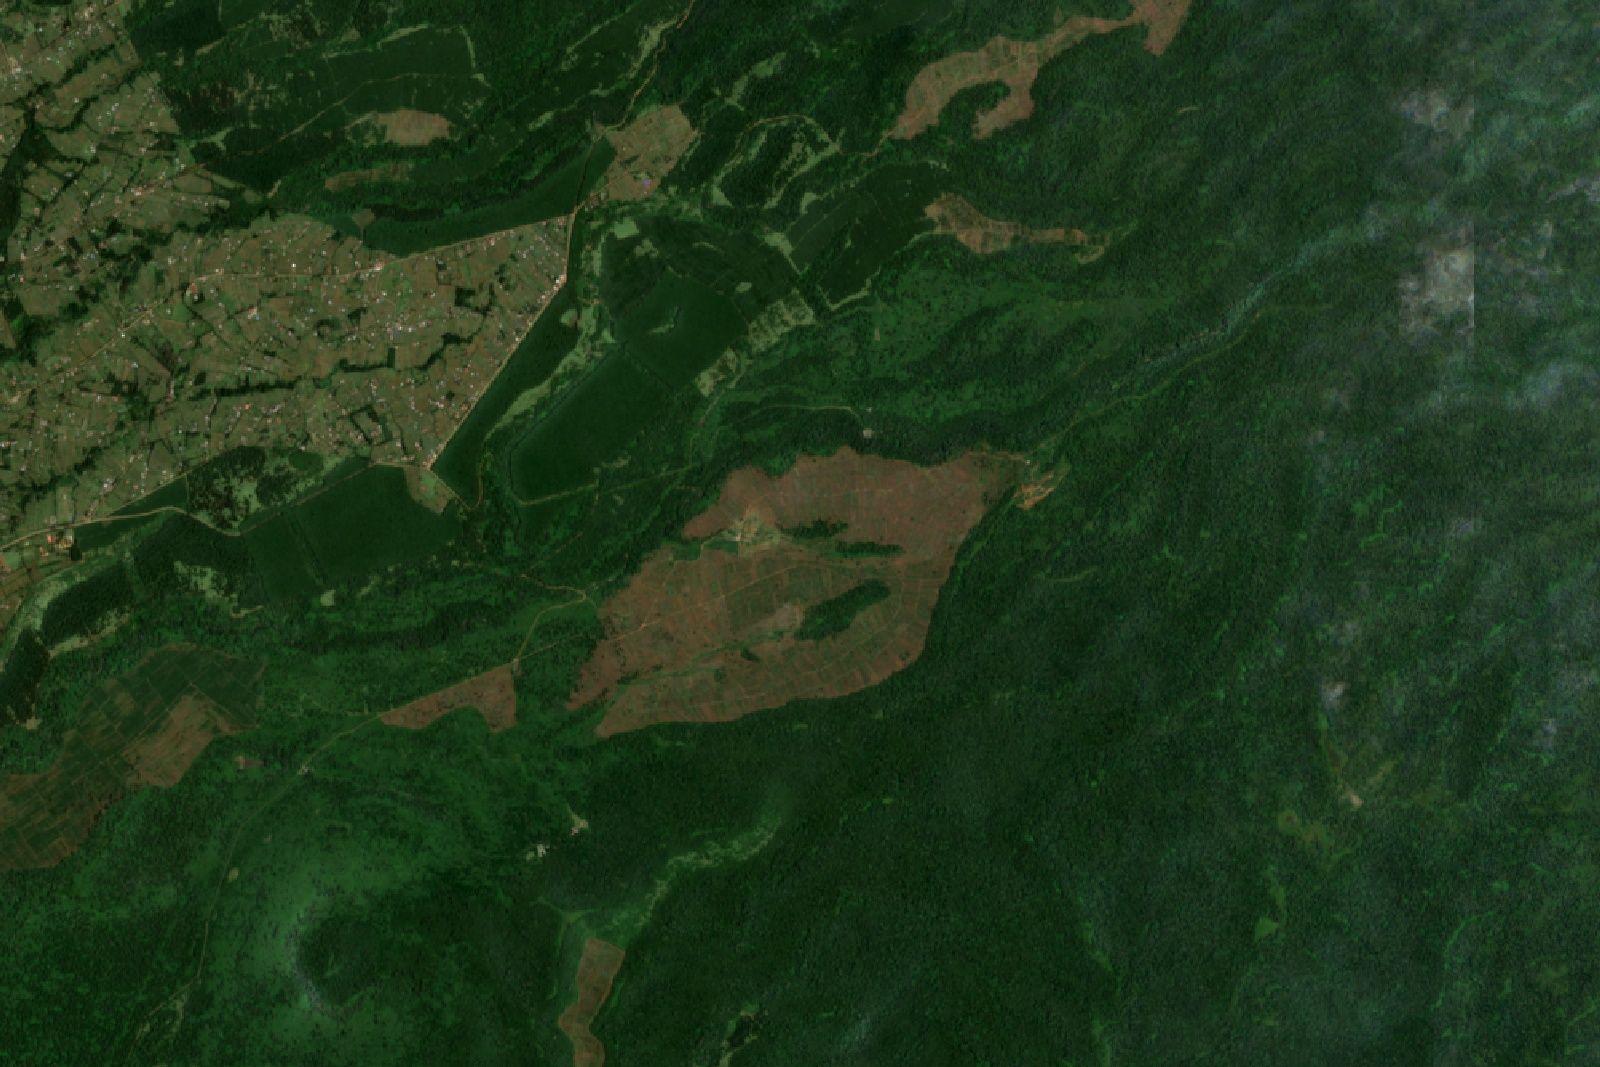
- Mean carbon density
- 6.8 t C/ha
- Total above-ground carbon
- 374.6M t C
- Stored carbon as CO₂ equivalent
- 1.4B t CO₂e
A stock held in vegetation, not yearly emissions - about 15× Kenya's total greenhouse-gas emissions in 2015 (93.7 Mt CO₂e, updated NDC).
Counties by carbon density
| # | County | Mean (t C/ha) | Total (t C) | Stored CO₂e (t) | Tree-cover loss since 2001 |
|---|---|---|---|---|---|
| 1 | Nyeri | 24.5 | 8.2M | 29.9M | 2.6% |
| 2 | Elgeyo-Marakwet | 22.6 | 6.8M | 25M | 7.9% |
| 3 | Bomet | 21.9 | 6.2M | 22.6M | 6.1% |
| 4 | Murang'a | 21.6 | 5.5M | 20.1M | 3.1% |
| 5 | Nandi | 21.4 | 6.1M | 22.5M | 7.8% |
| 6 | Kisii | 21.2 | 2.8M | 10.1M | 2.2% |
| 7 | Nyamira | 21.0 | 1.9M | 6.8M | 7.8% |
| 8 | Kericho | 20.9 | 4.4M | 16.1M | 10.0% |
| 9 | Vihiga | 19.8 | 1.1M | 4.1M | 1.8% |
| 10 | Baringo | 19.0 | 20.1M | 73.7M | 2.3% |
| 11 | Kirinyaga | 18.9 | 2.8M | 10.2M | 1.3% |
| 12 | Kiambu | 17.1 | 4.4M | 16M | 5.1% |
| 13 | West Pokot | 17.0 | 15.4M | 56.6M | 2.2% |
| 14 | Kakamega | 16.4 | 4.9M | 18M | 3.2% |
| 15 | Nyandarua | 15.8 | 5.2M | 18.9M | 4.2% |
| 16 | Bungoma | 15.7 | 4.7M | 17.3M | 2.5% |
| 17 | Trans Nzoia | 15.3 | 3.8M | 13.9M | 3.6% |
| 18 | Tharaka-Nithi | 15.1 | 4M | 14.8M | 2.9% |
| 19 | Embu | 13.3 | 3.7M | 13.6M | 3.1% |
| 20 | Meru | 13.2 | 9.1M | 33.4M | 1.0% |
| 21 | Nakuru | 11.4 | 8.2M | 30.2M | 5.7% |
| 22 | Samburu | 10.9 | 22.8M | 83.6M | 0.1% |
| 23 | Nairobi | 10.8 | 569.9K | 2.1M | 1.1% |
| 24 | Narok | 10.8 | 19.2M | 70.5M | 5.3% |
| 25 | Lamu | 10.0 | 5.9M | 21.6M | 5.8% |
| 26 | Mombasa | 9.9 | 162.2K | 594.8K | 6.7% |
| 27 | Homa Bay | 9.9 | 3.1M | 11.3M | 0.7% |
| 28 | Kitui | 9.9 | 30.1M | 110.3M | 1.6% |
| 29 | Siaya | 9.4 | 2.3M | 8.5M | 2.3% |
| 30 | Busia | 9.3 | 1.6M | 5.7M | 2.4% |
| 31 | Kisumu | 9.2 | 1.9M | 7M | 1.6% |
| 32 | Uasin Gishu | 8.9 | 3M | 10.8M | 4.9% |
| 33 | Migori | 8.6 | 2.2M | 8.2M | 1.2% |
| 34 | Makueni | 8.2 | 6.6M | 24.1M | 1.2% |
| 35 | Kilifi | 7.4 | 9M | 33.1M | 3.9% |
| 36 | Kwale | 6.7 | 5.4M | 19.8M | 3.9% |
| 37 | Kajiado | 6.0 | 13M | 47.6M | 0.1% |
| 38 | Turkana | 5.8 | 27.6M | 101.3M | 0.0% |
| 39 | Taita-Taveta | 5.4 | 9.2M | 33.6M | 0.2% |
| 40 | Laikipia | 5.0 | 4.8M | 17.7M | 1.4% |
| 41 | Machakos | 4.9 | 3M | 11.1M | 0.5% |
| 42 | Mandera | 4.5 | 11.6M | 42.6M | 0.0% |
| 43 | Garissa | 3.7 | 16.6M | 61M | 0.1% |
| 44 | Isiolo | 3.3 | 8.3M | 30.6M | 0.0% |
| 45 | Tana River | 3.2 | 12.2M | 44.9M | 0.5% |
| 46 | Marsabit | 2.5 | 16.8M | 61.7M | 0.0% |
| 47 | Wajir | 1.8 | 10.3M | 37.9M | 0.0% |
County totals are summed from finer pixels than the national figure, so together they come to within0.6% of the national total above (376.8M vs 374.6M t C). Tree-cover loss is the share of each county where Hansen Global Forest Change recorded loss in any year since 2001 - not necessarily permanent deforestation.
Behind the county numbers
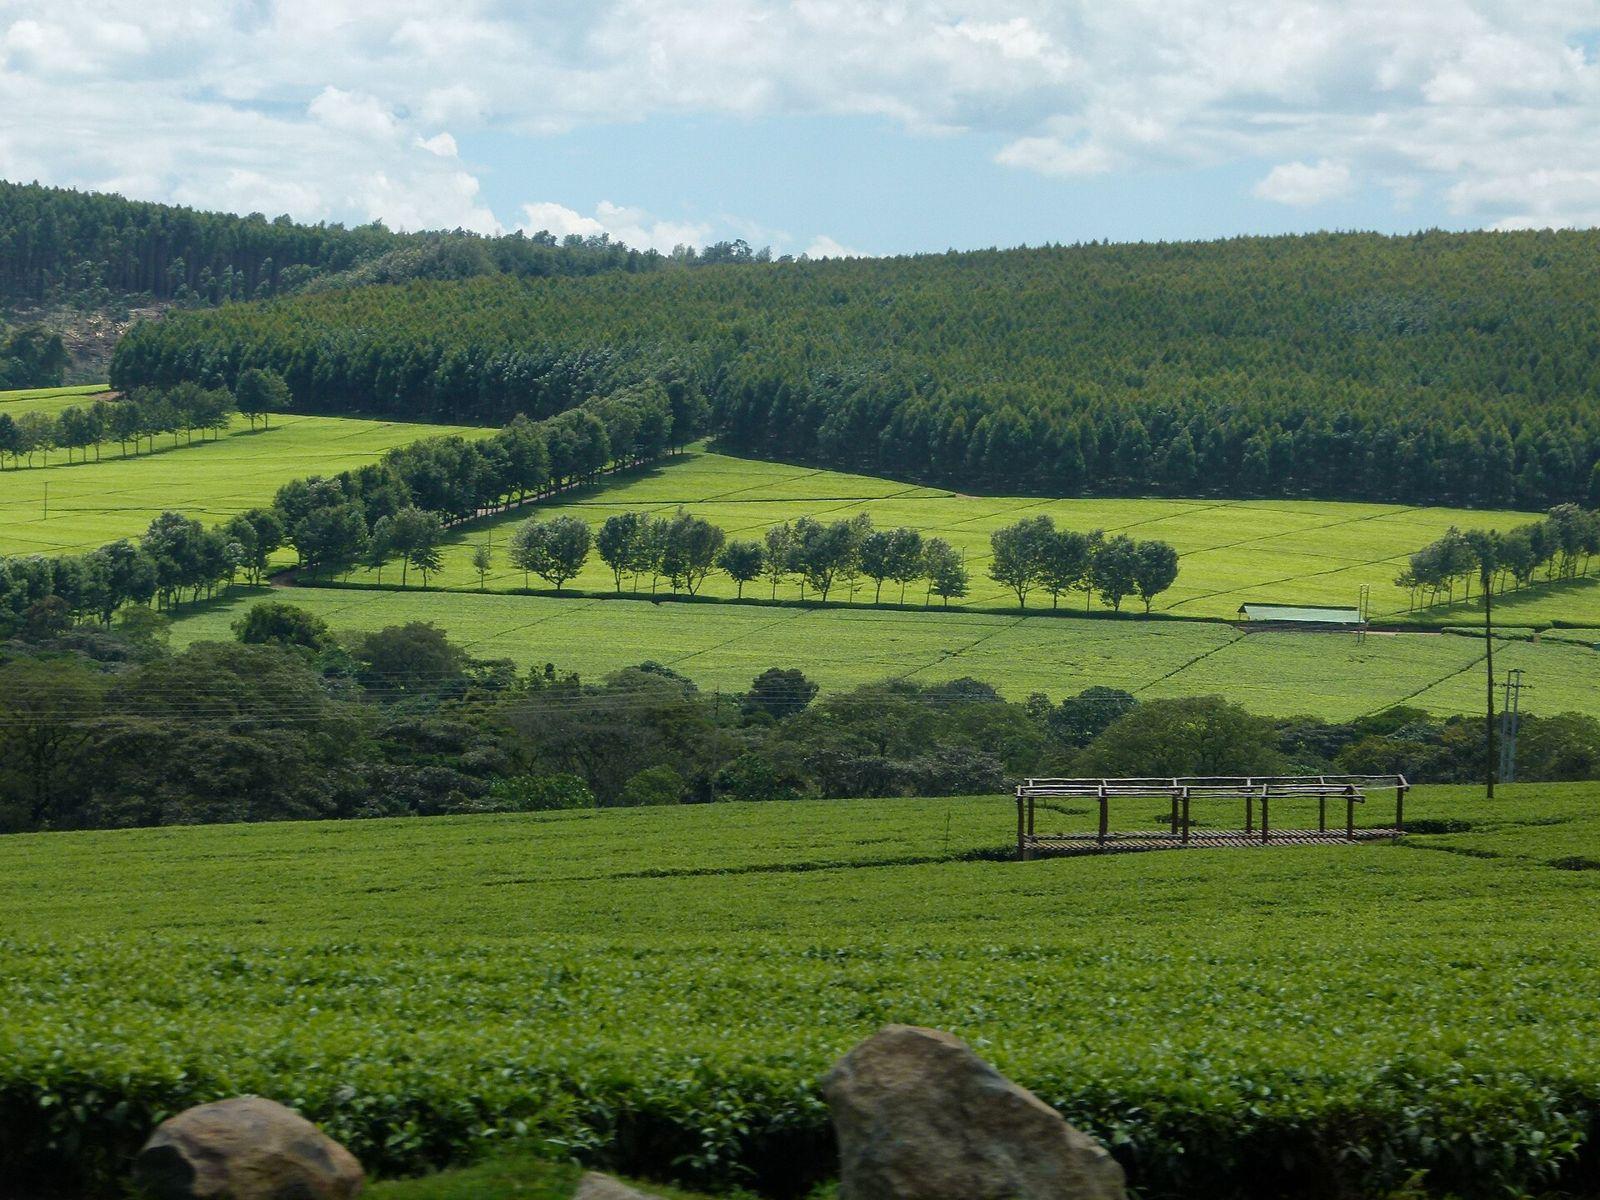
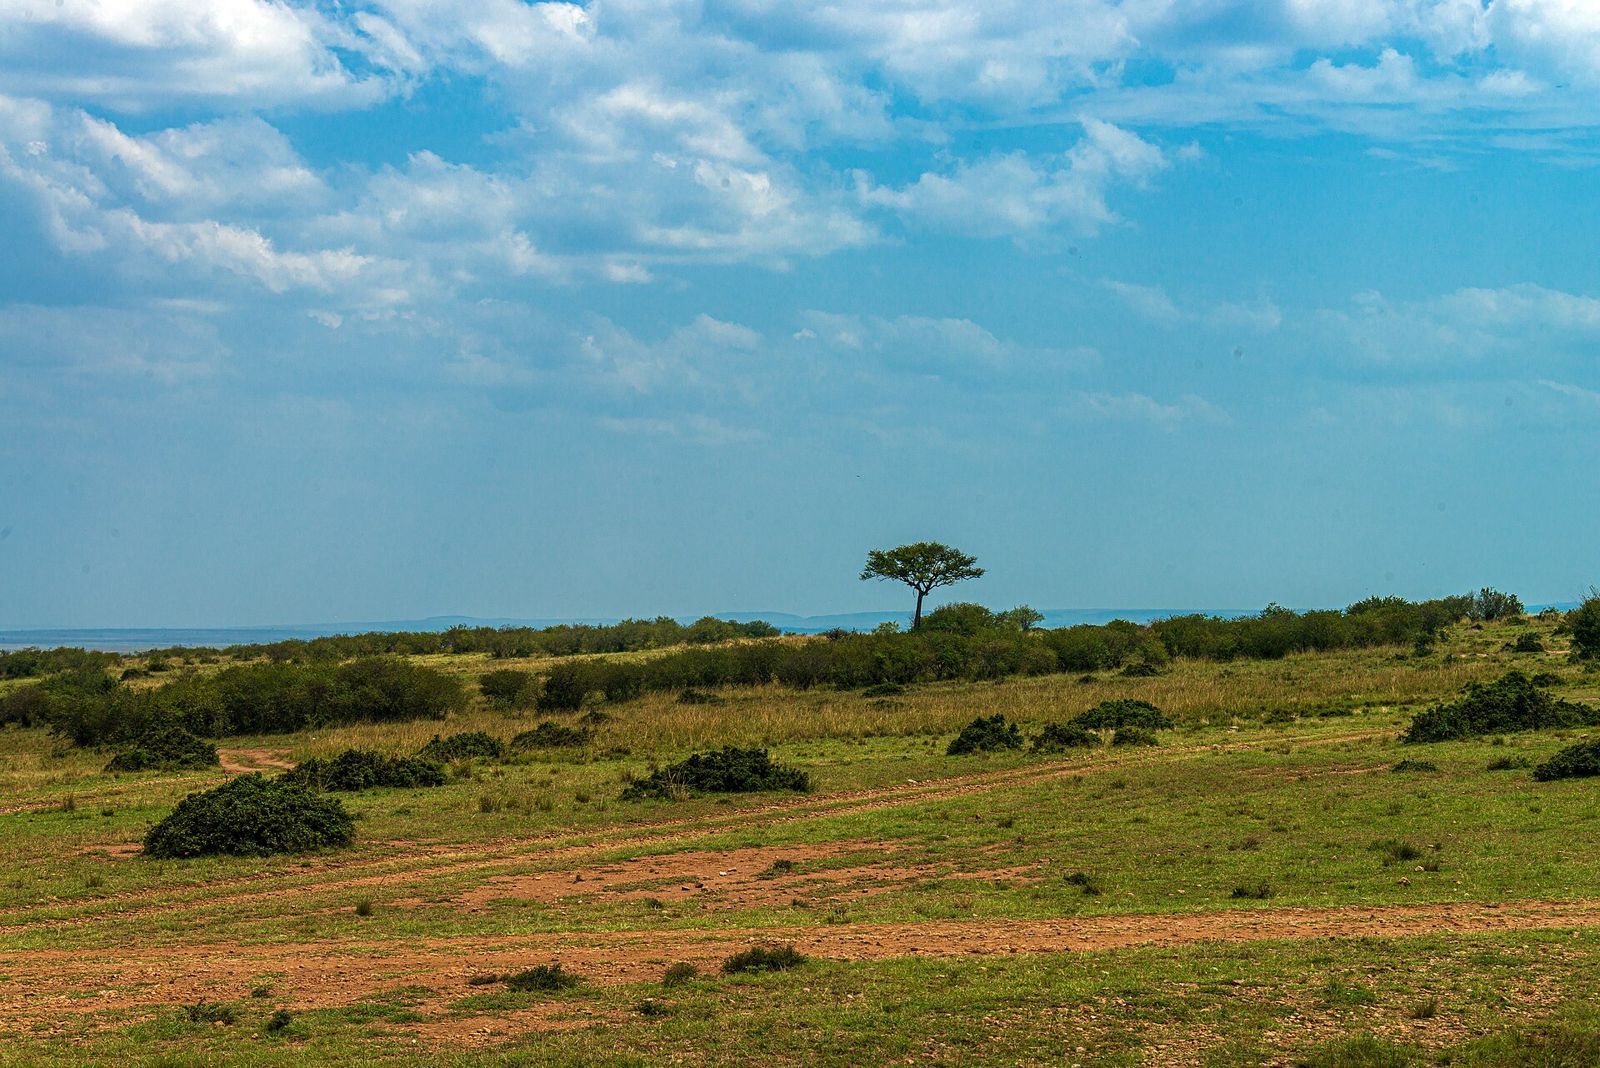
Rainforest in Kakamega, tea and forest in Kericho, savanna in Narok - the range Kenya's 47 counties span.
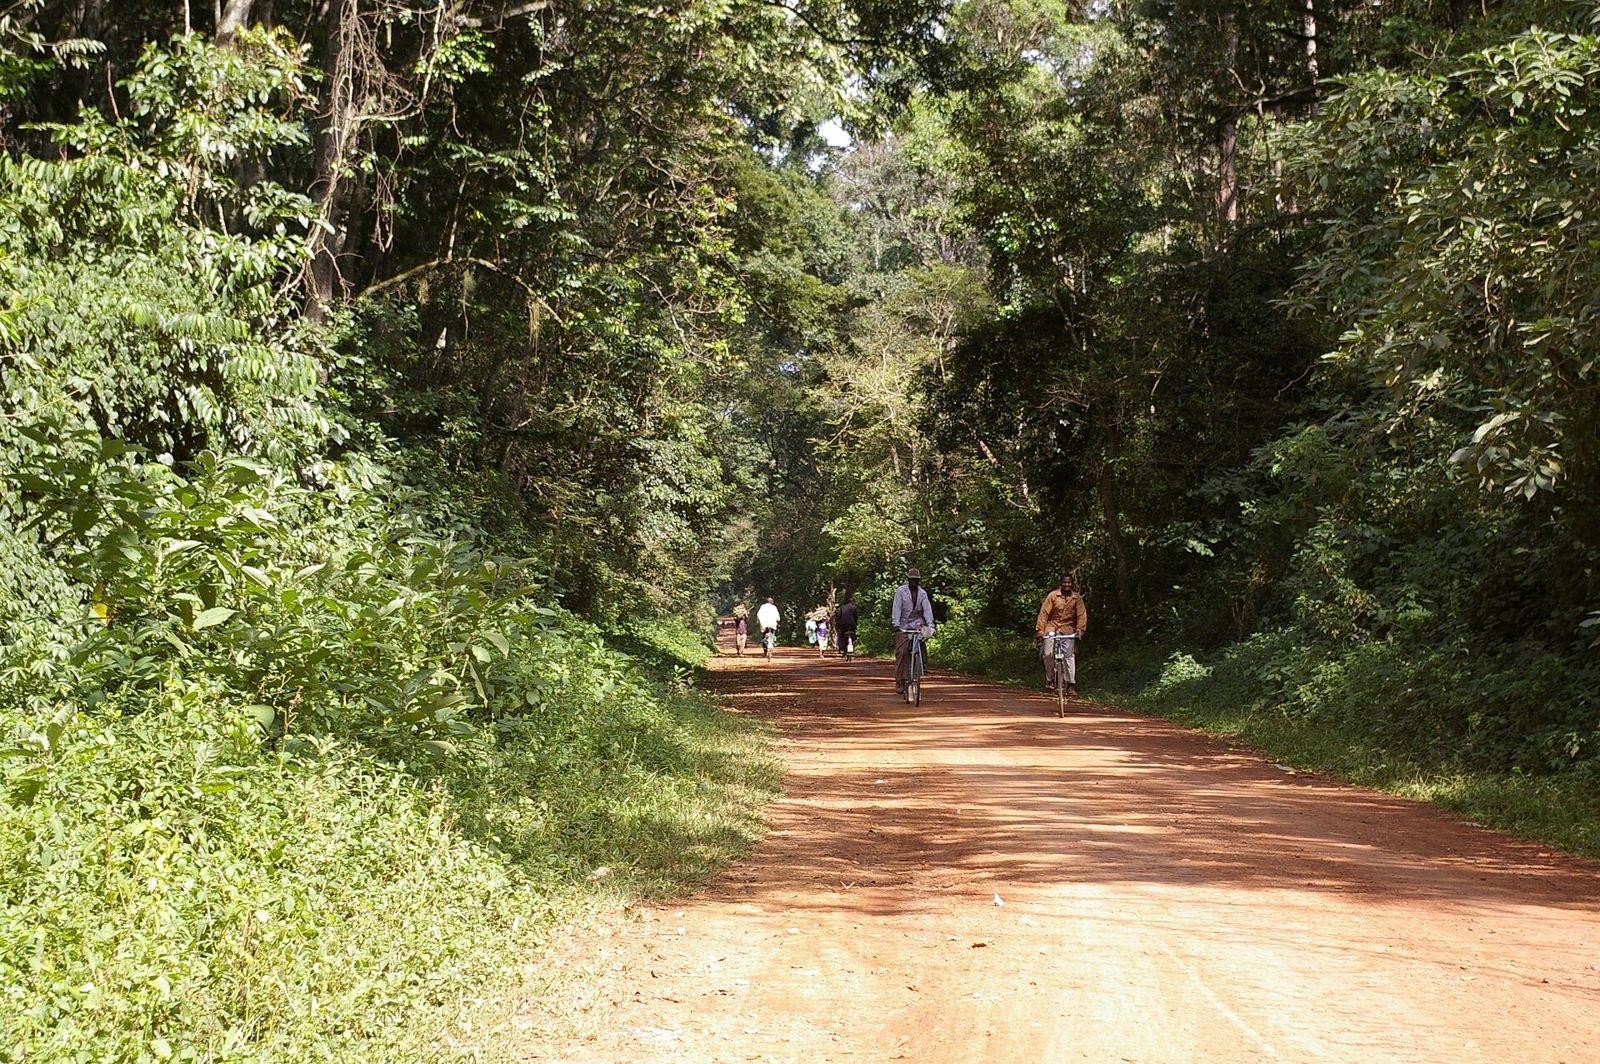
44 counties on the ground
A real photograph taken in each county - open one for its carbon figures, map and history.
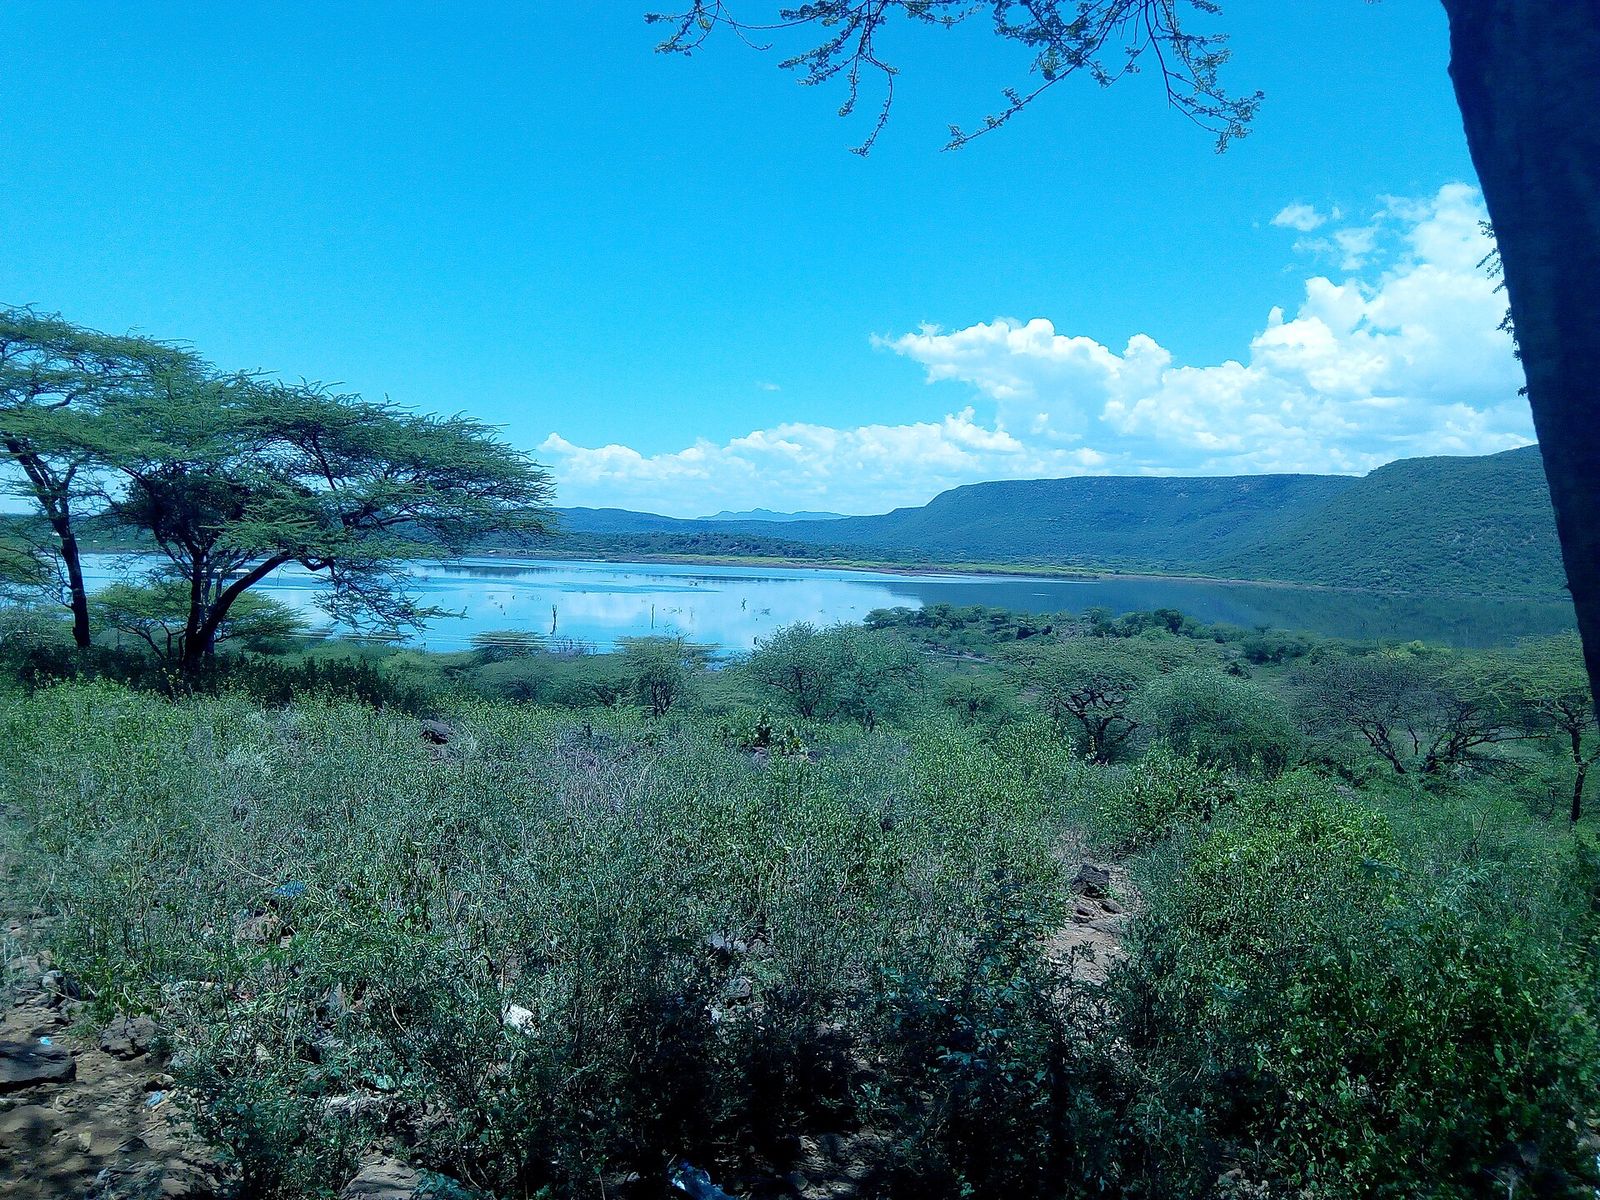
Baringo
Photo: Geomurki, CC BY-SA 4.0, via Wikimedia Commons (resized)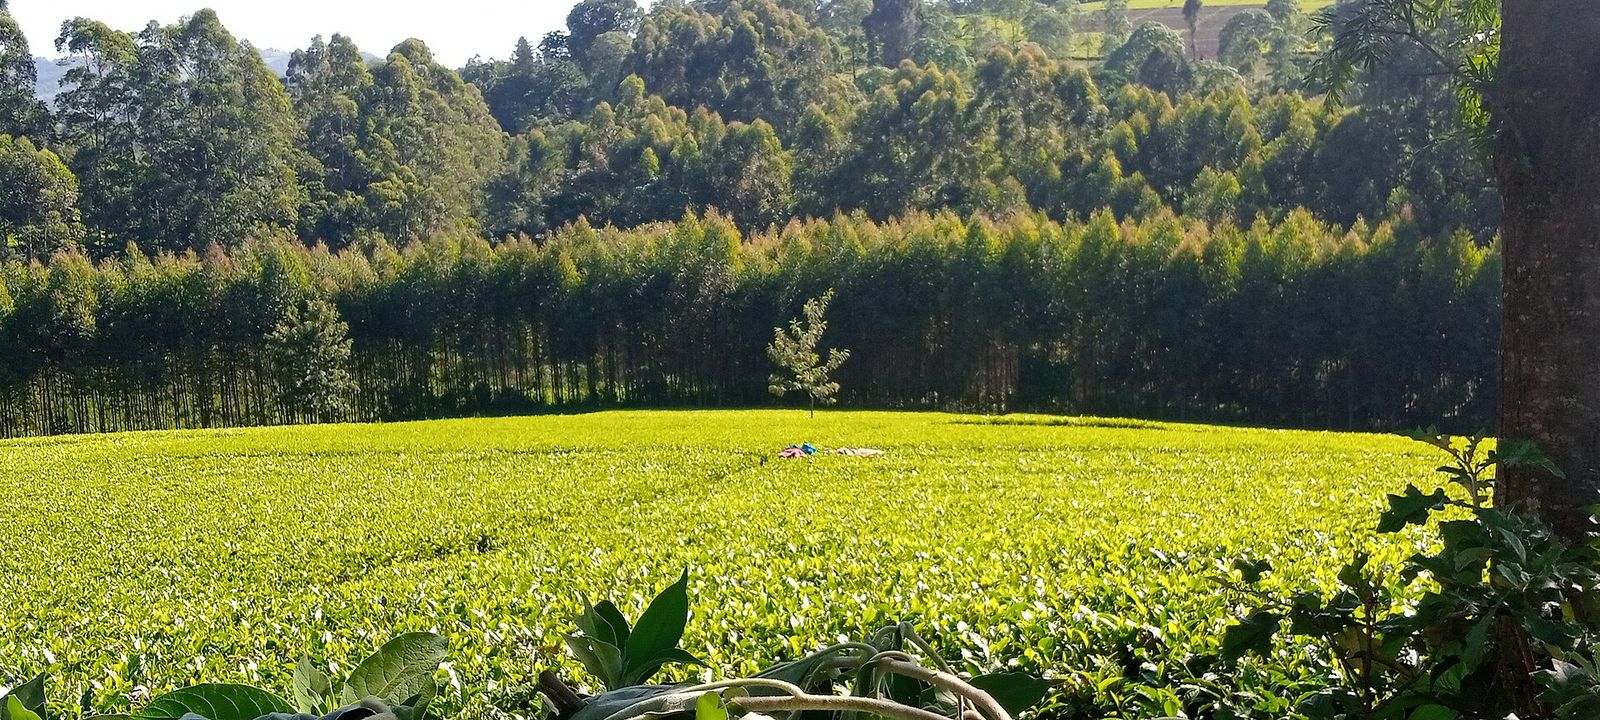
Bomet
Photo: Kipkorir Cheruiyot, CC BY-SA 4.0, via Wikimedia Commons (resized)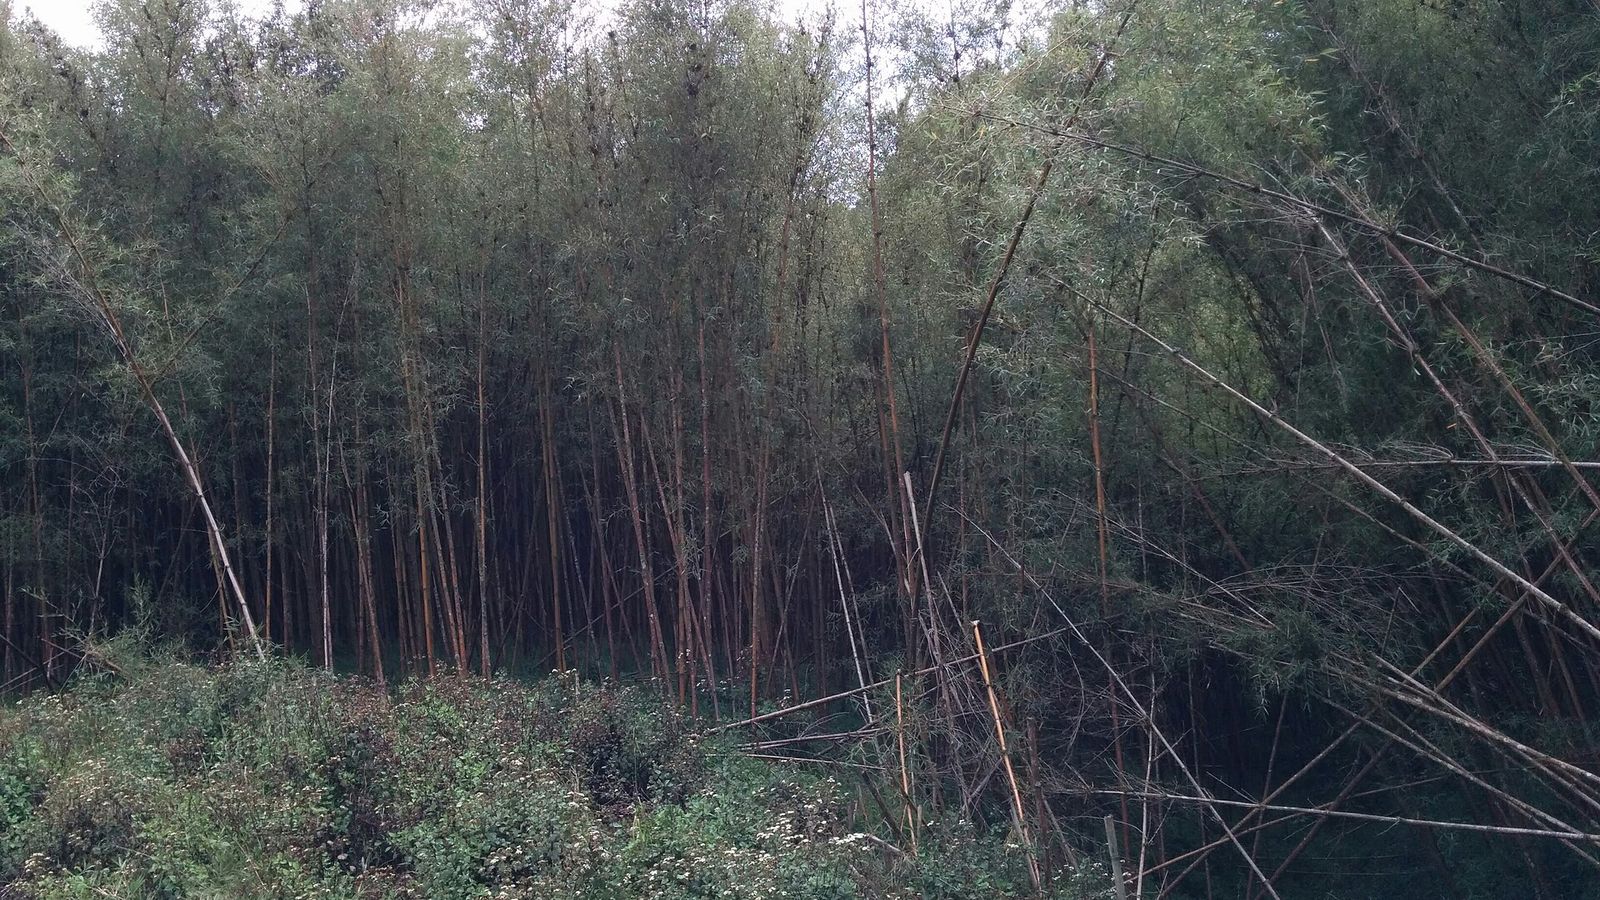
Bungoma
Photo: datakid musicman, CC BY-SA 2.0, via Wikimedia Commons (resized)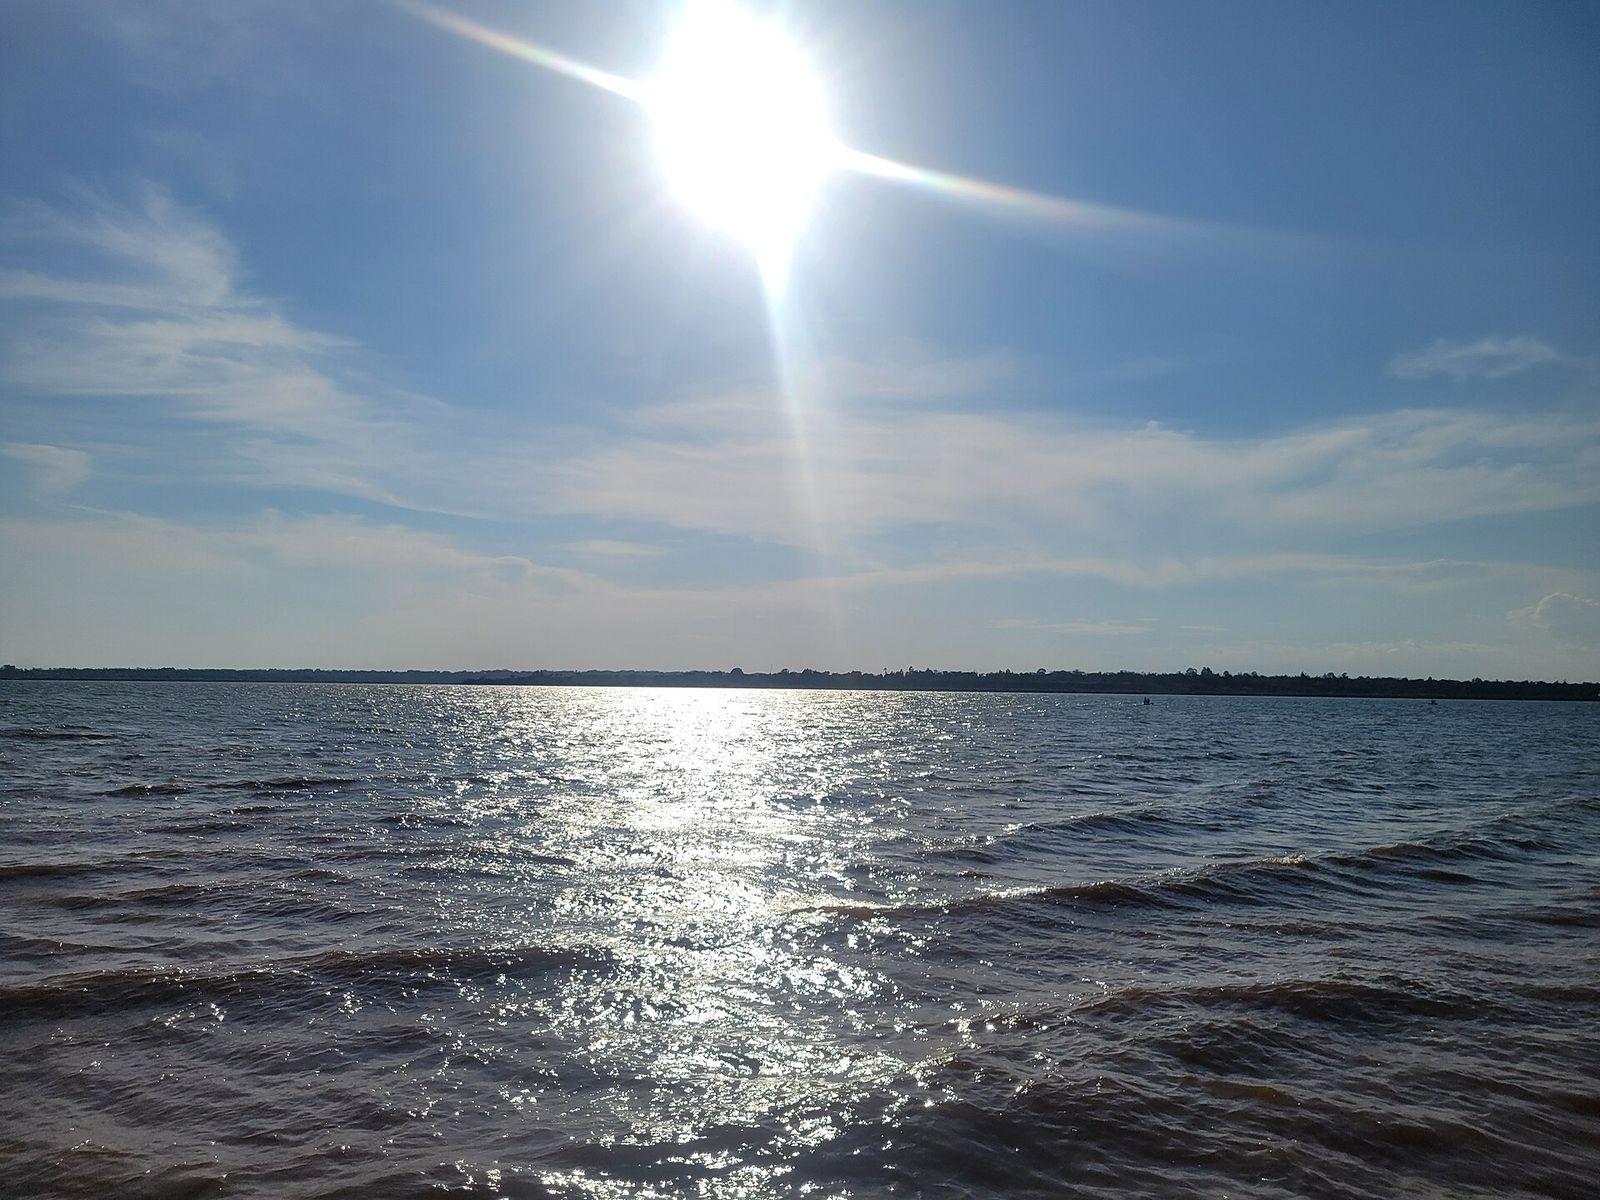
Busia
Photo: Rodney Rwagi, CC0, via Wikimedia Commons (resized)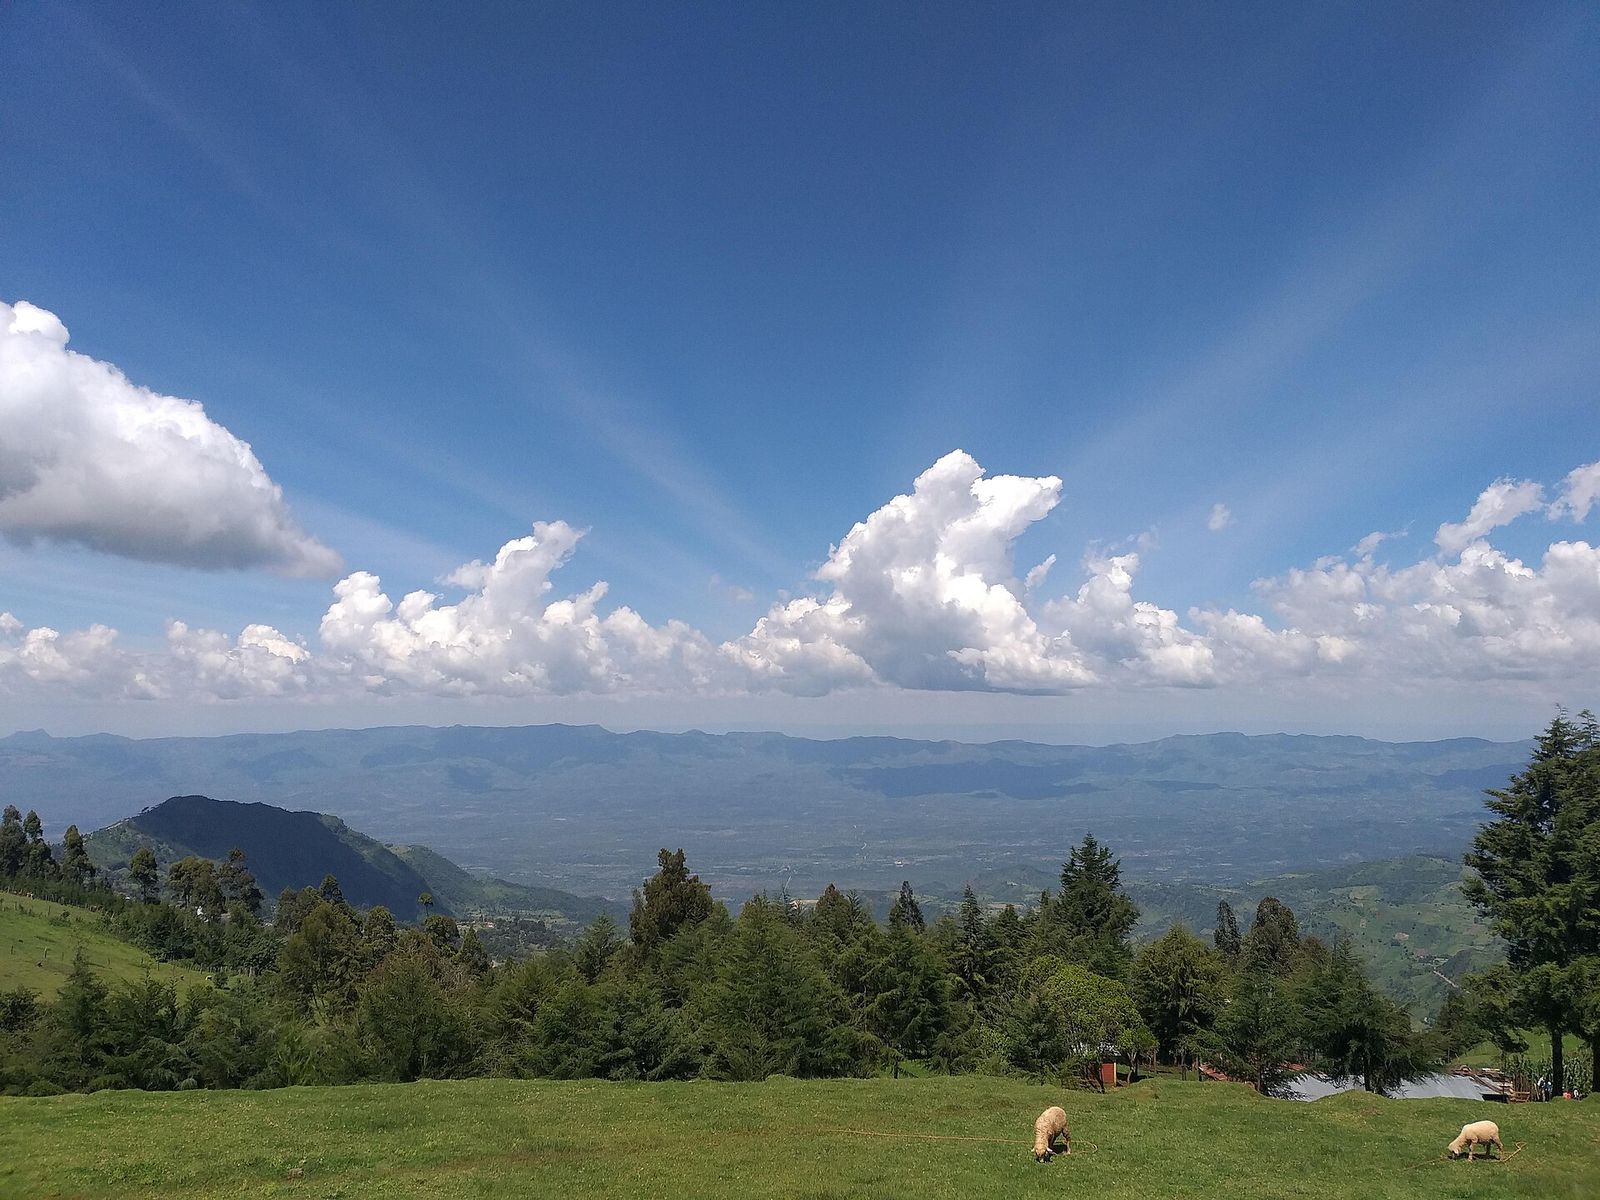
Elgeyo-Marakwet
Photo: Mekami, CC BY-SA 4.0, via Wikimedia Commons (resized)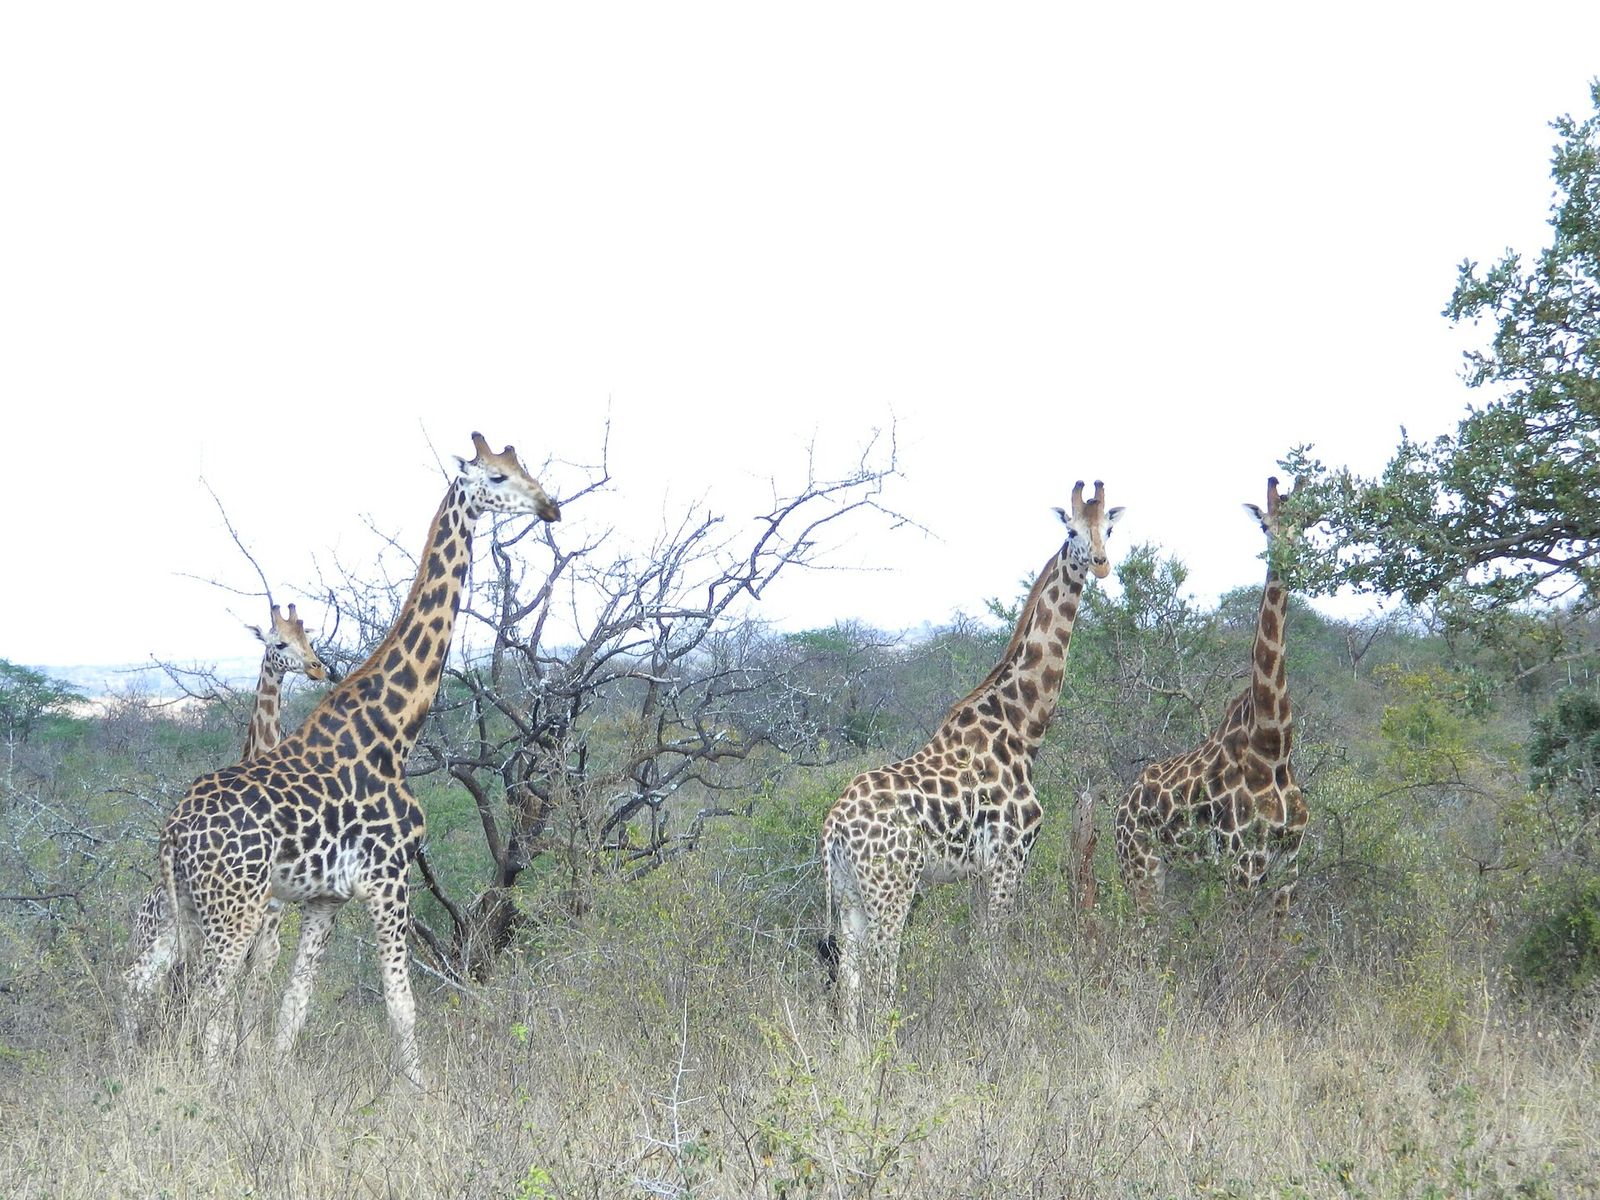
Embu
Photo: EduMwaniki, CC BY-SA 3.0, via Wikimedia Commons (resized)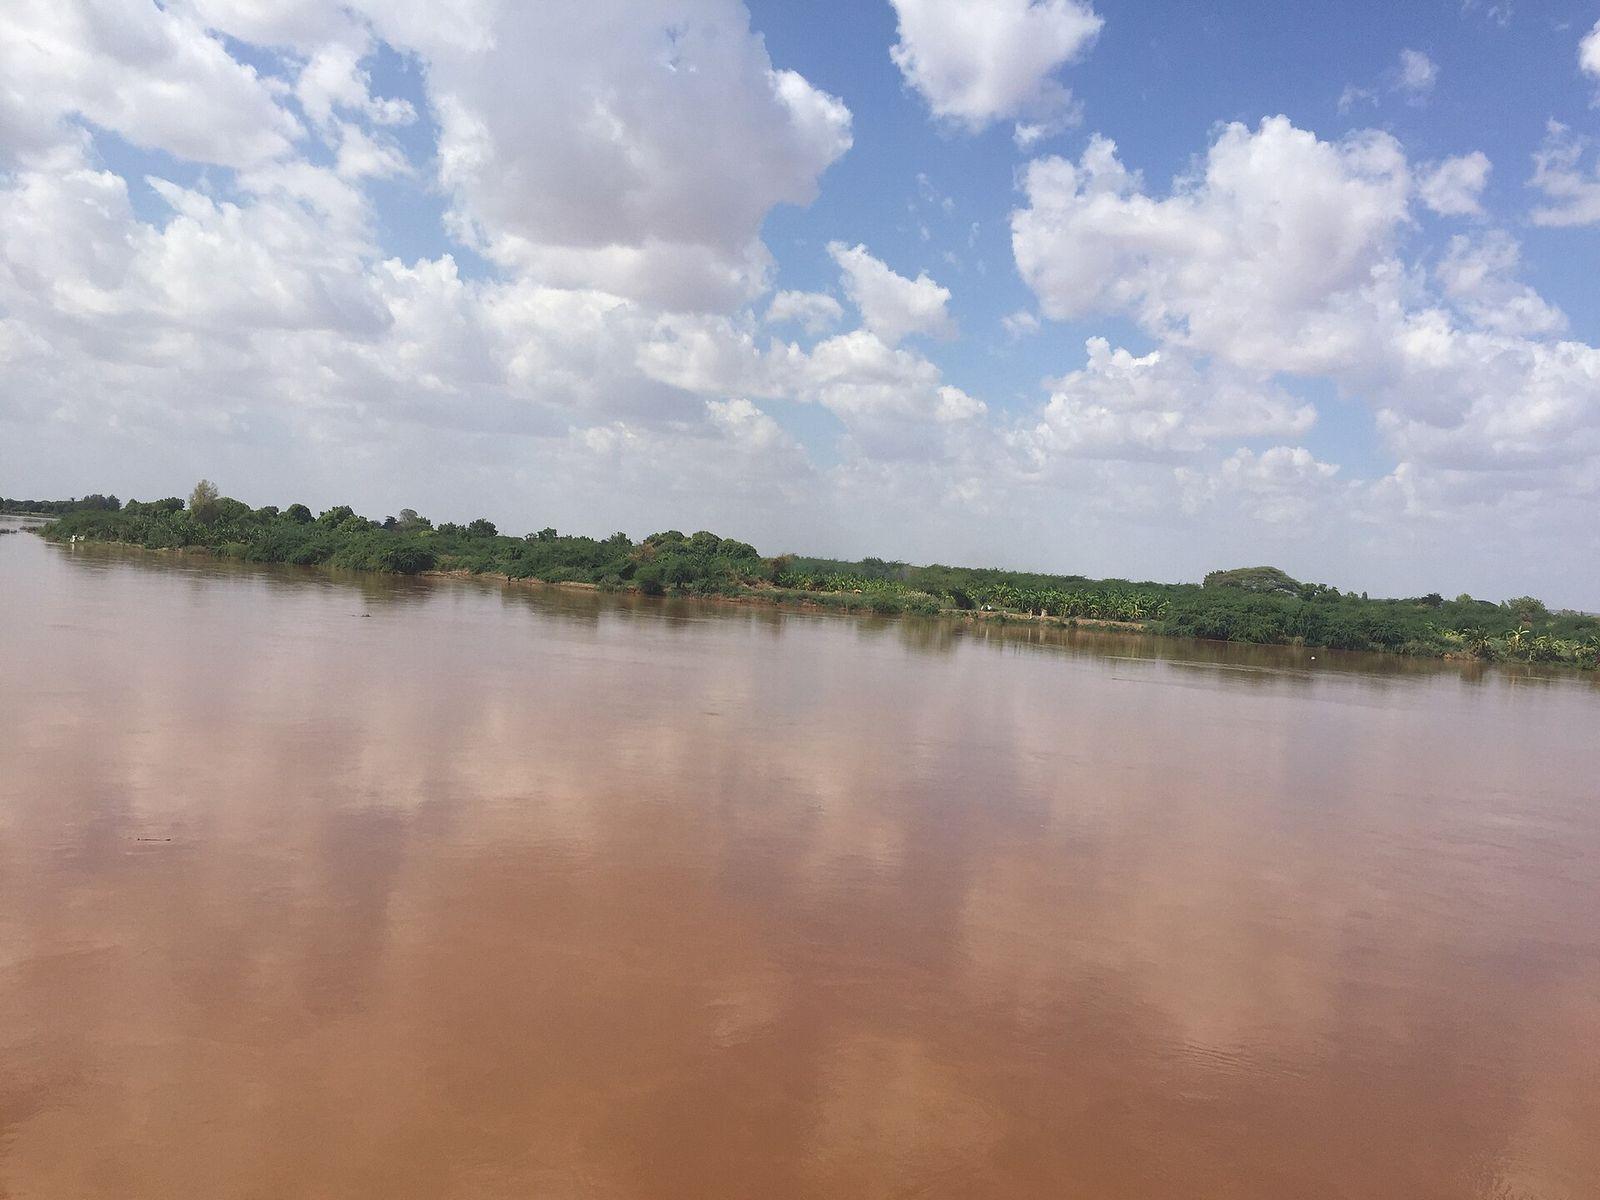
Garissa
Photo: Adam H T Geelle, CC BY 3.0, via Wikimedia Commons (resized)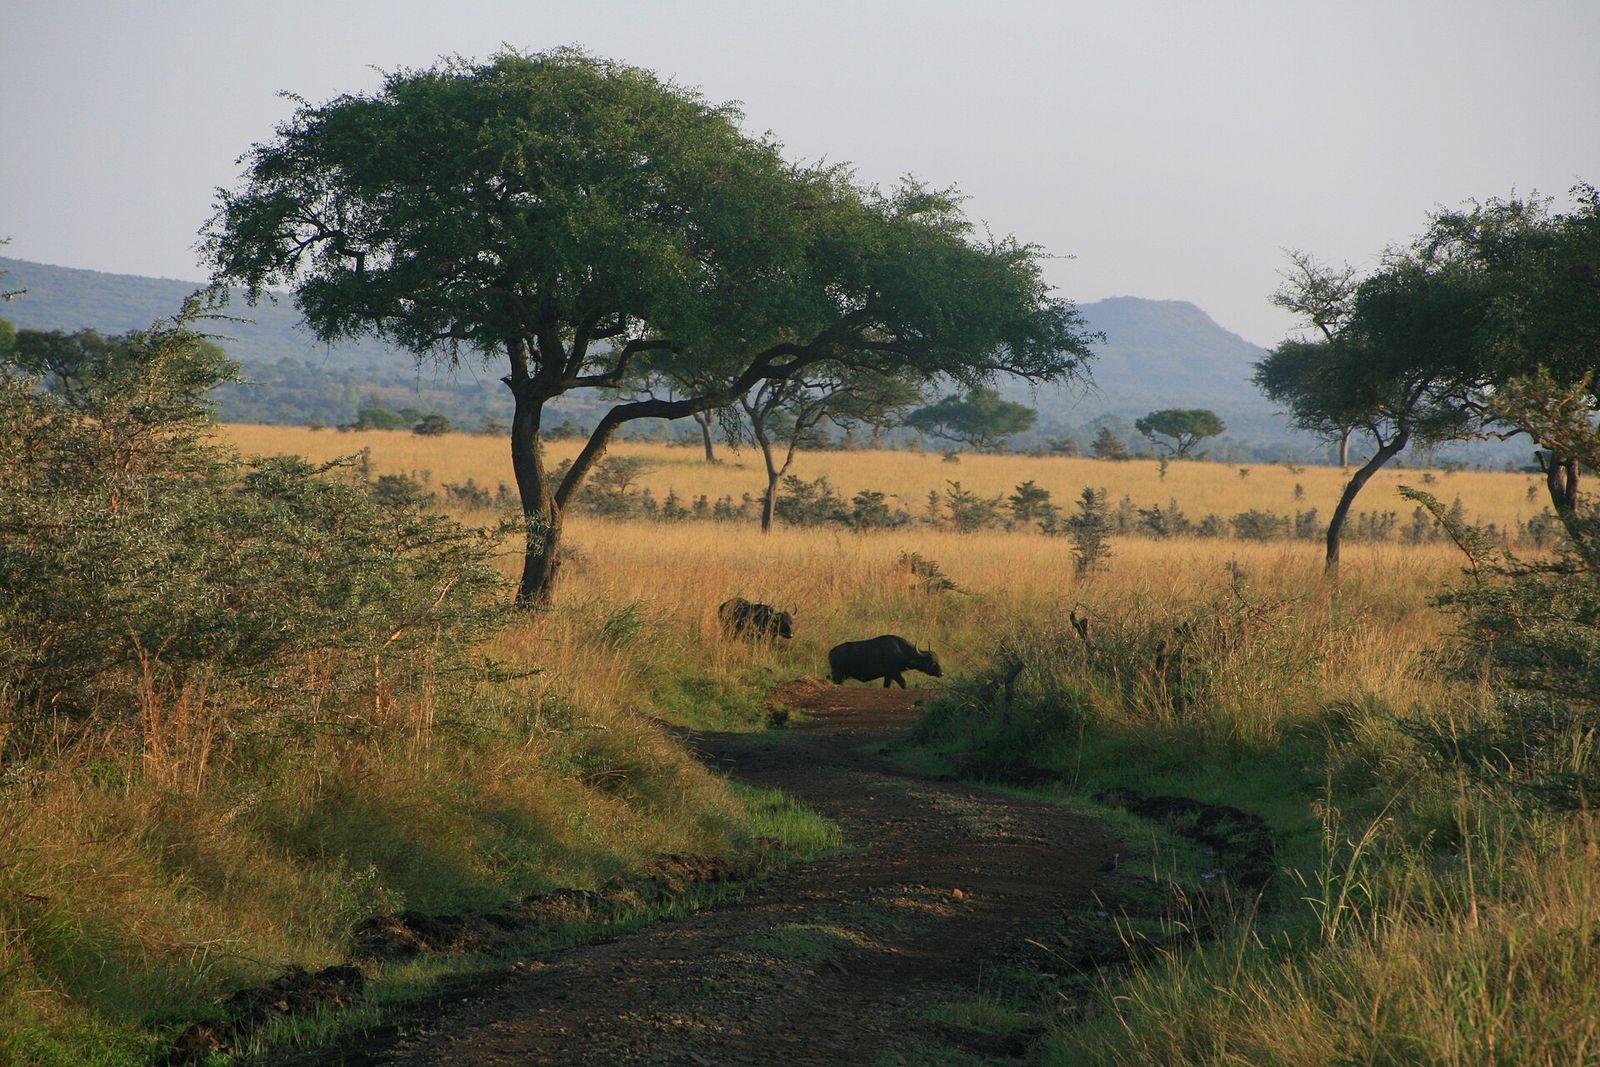
Homa Bay
Photo: Michiel Van Balen from Leuven, Belgium, CC BY 2.0, via Wikimedia Commons (resized)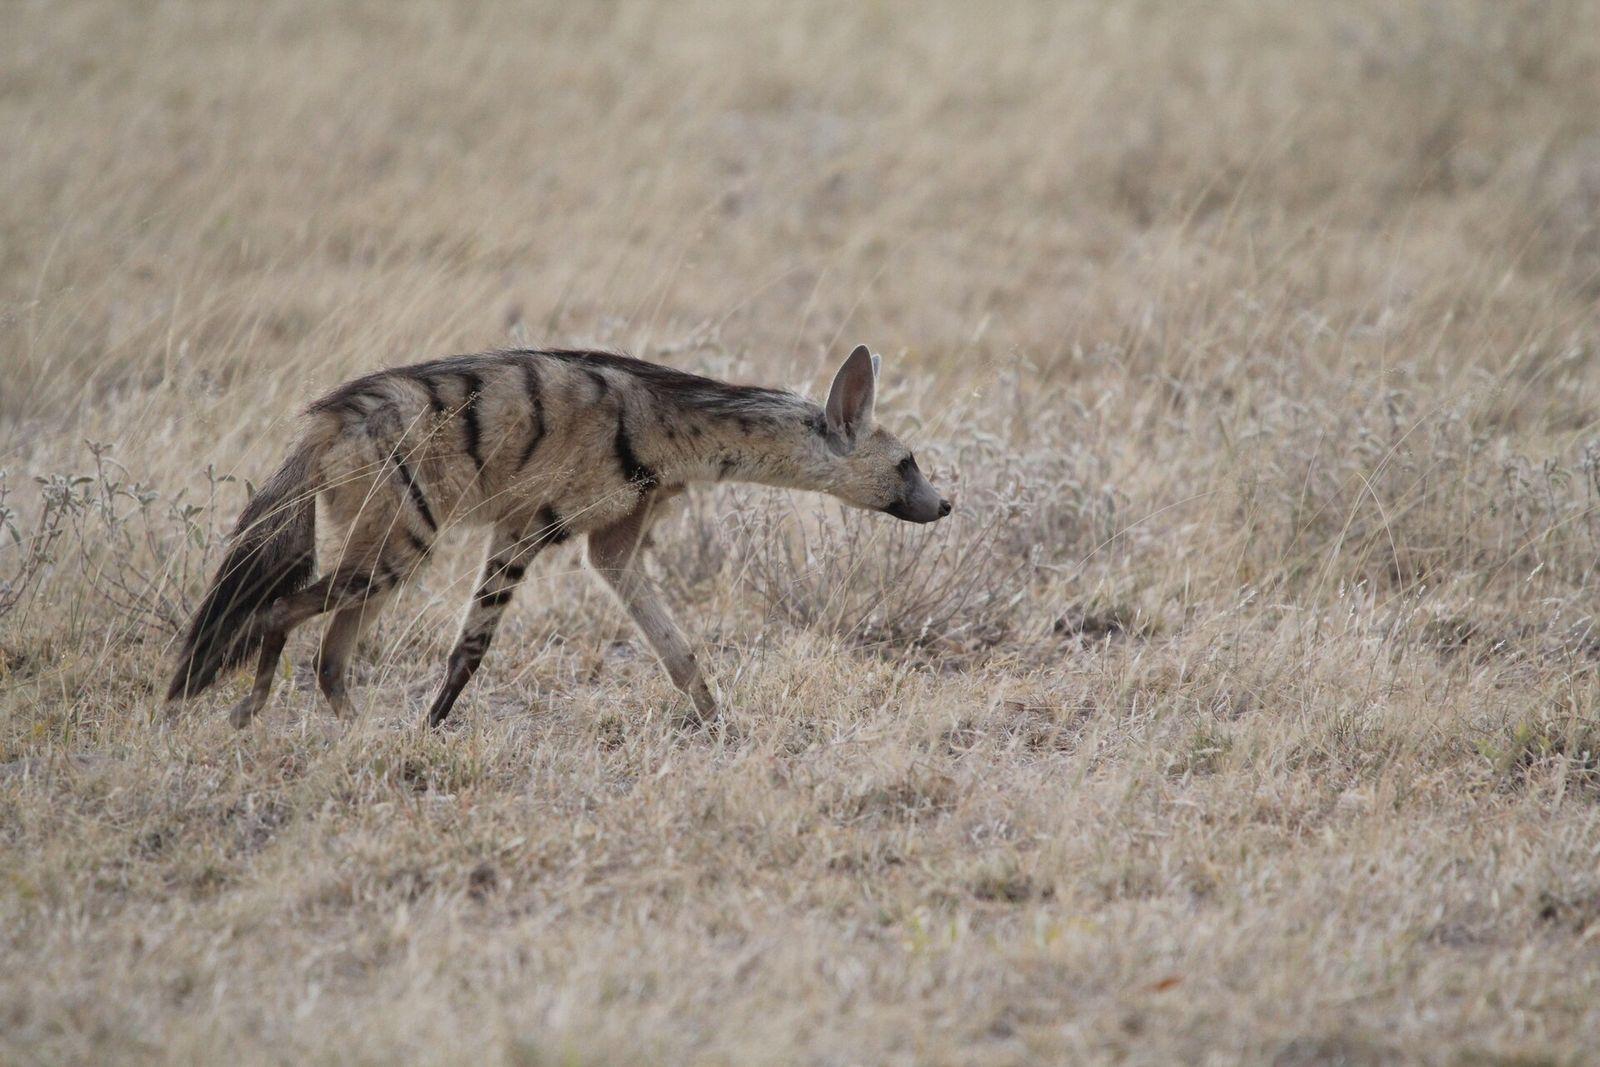
Isiolo
Photo: Stefan Haag, CC BY 4.0, via Wikimedia Commons (resized)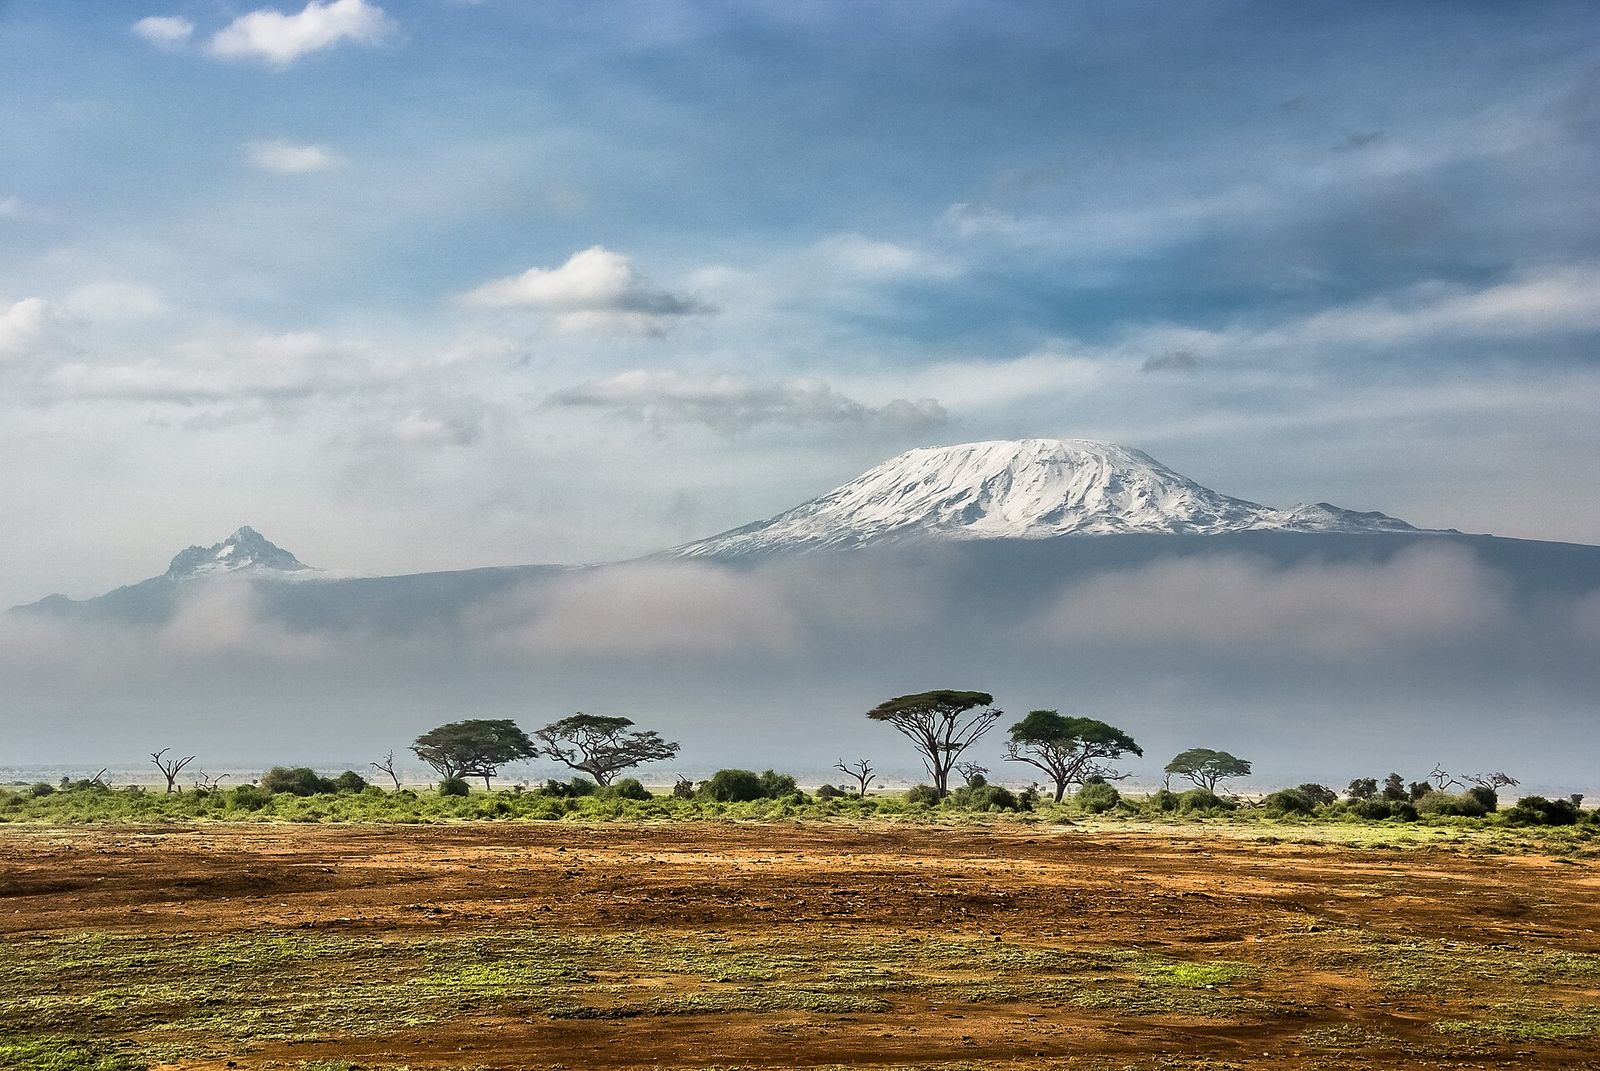
Kajiado
Photo: Sergey Pesterev, CC BY-SA 4.0, via Wikimedia Commons (resized)Kakamega
Photo: Nao Iizuka, CC BY 3.0, via Wikimedia Commons (resized)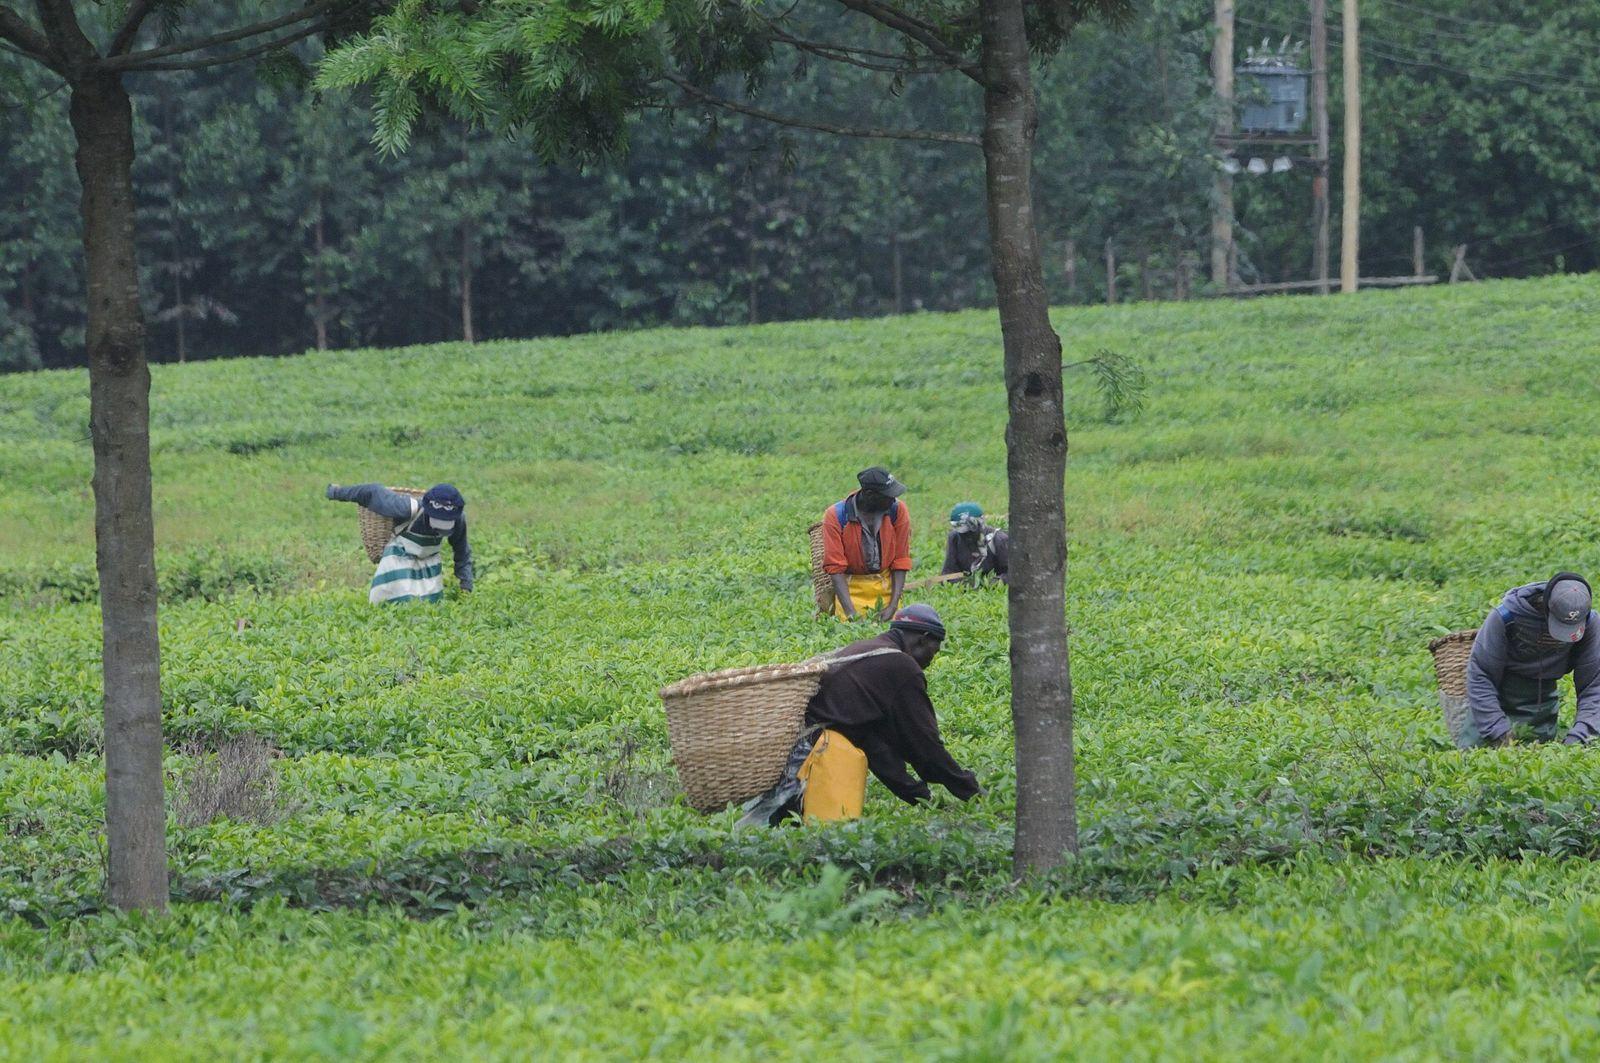
Kericho
Photo: Josep M. Gracia, CC BY-SA 4.0, via Wikimedia Commons (resized)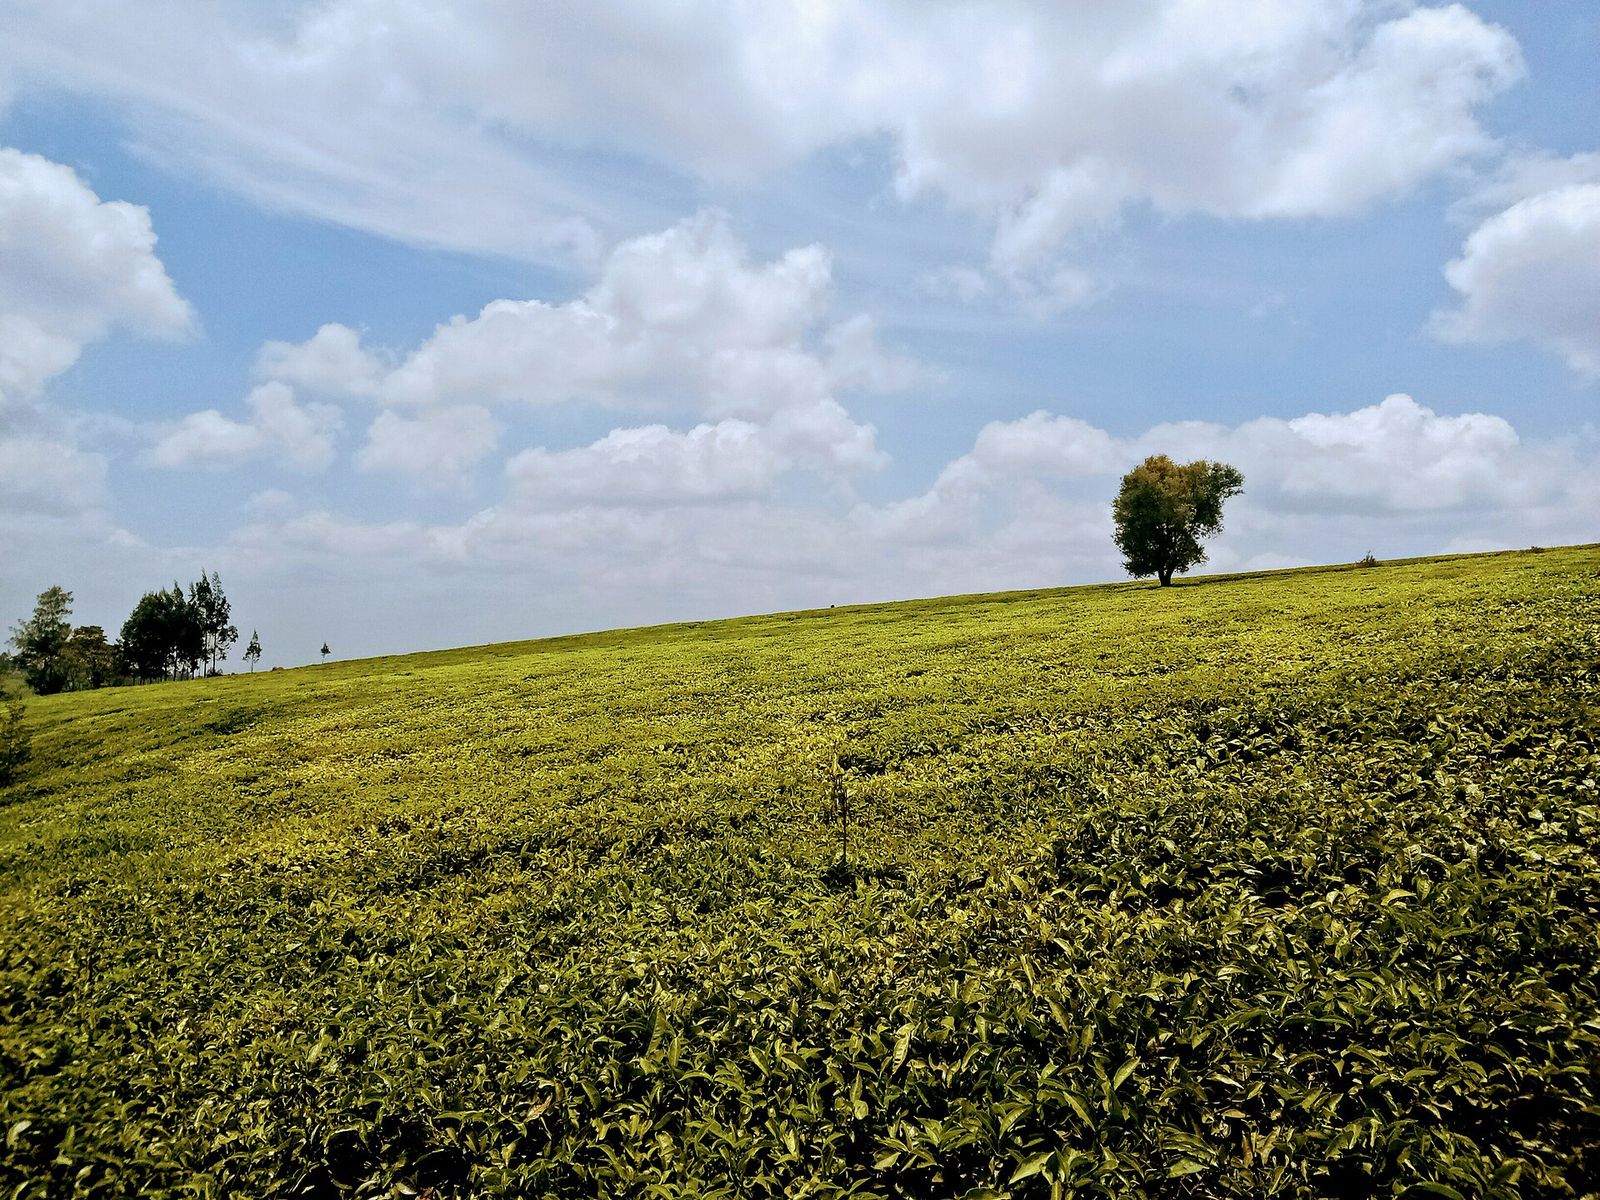
Kiambu
Photo: Debbie Buyaki, CC BY-SA 4.0, via Wikimedia Commons (resized)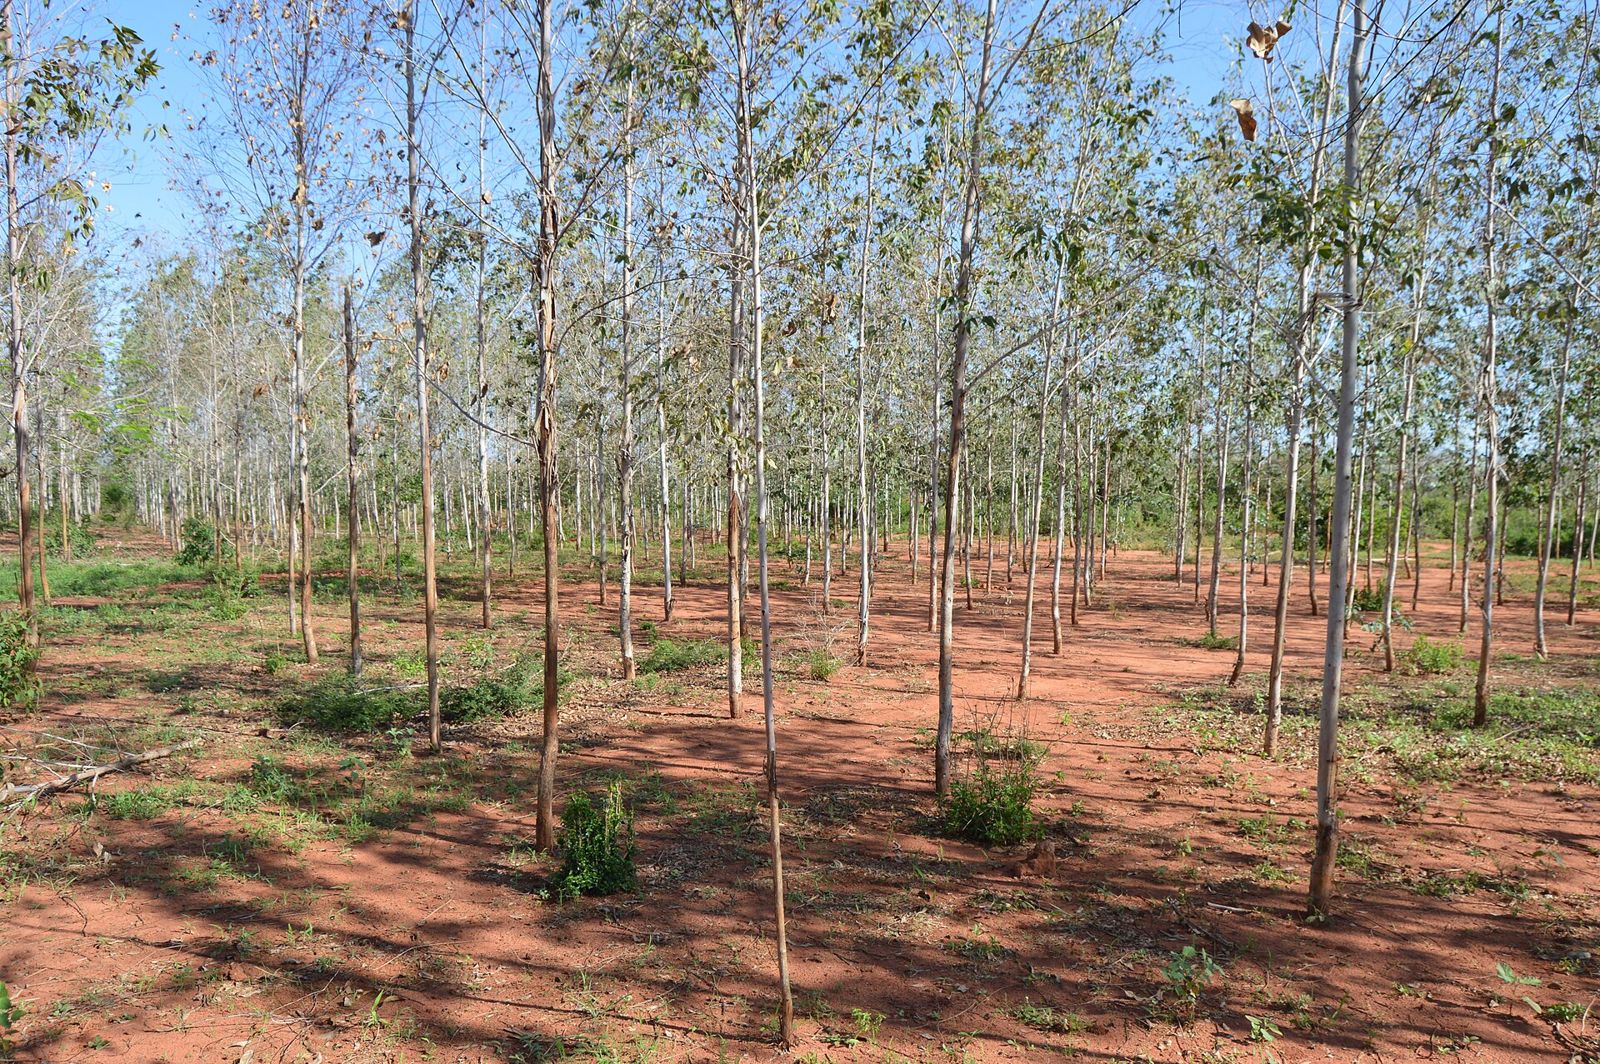
Kilifi
Photo: Chris Obiero, CC BY-SA 4.0, via Wikimedia Commons (resized)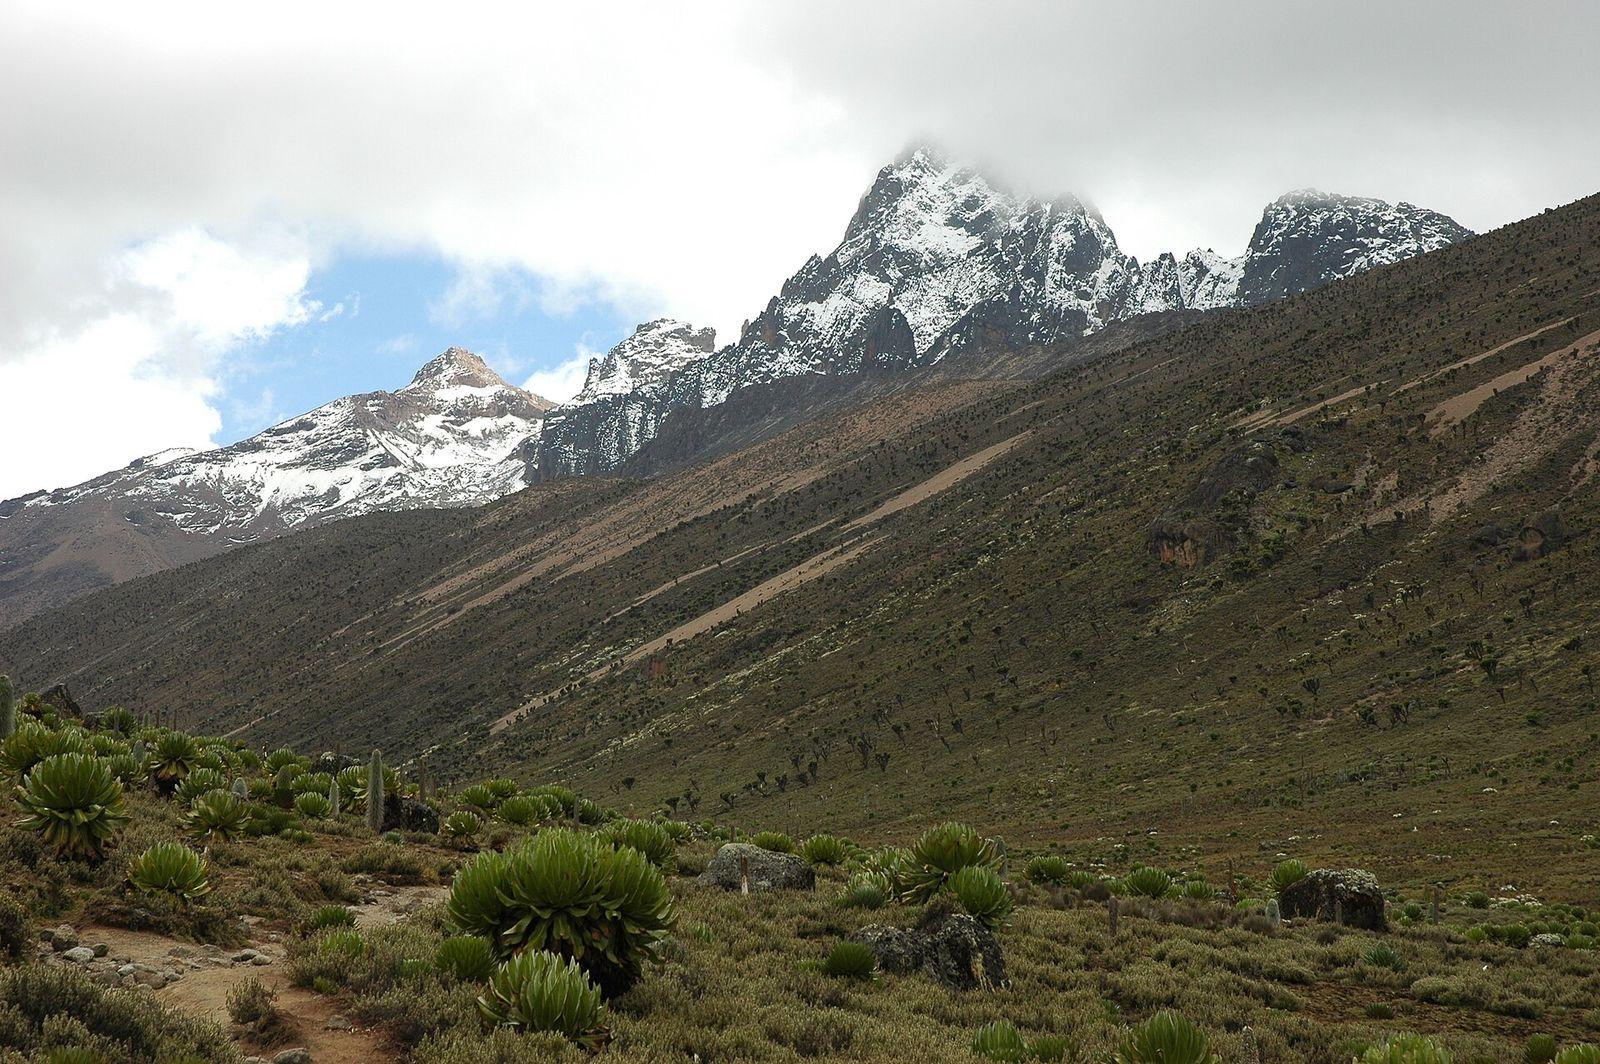
Kirinyaga
Photo: Ruud Zwart, CC BY-SA 2.5 nl, via Wikimedia Commons (resized)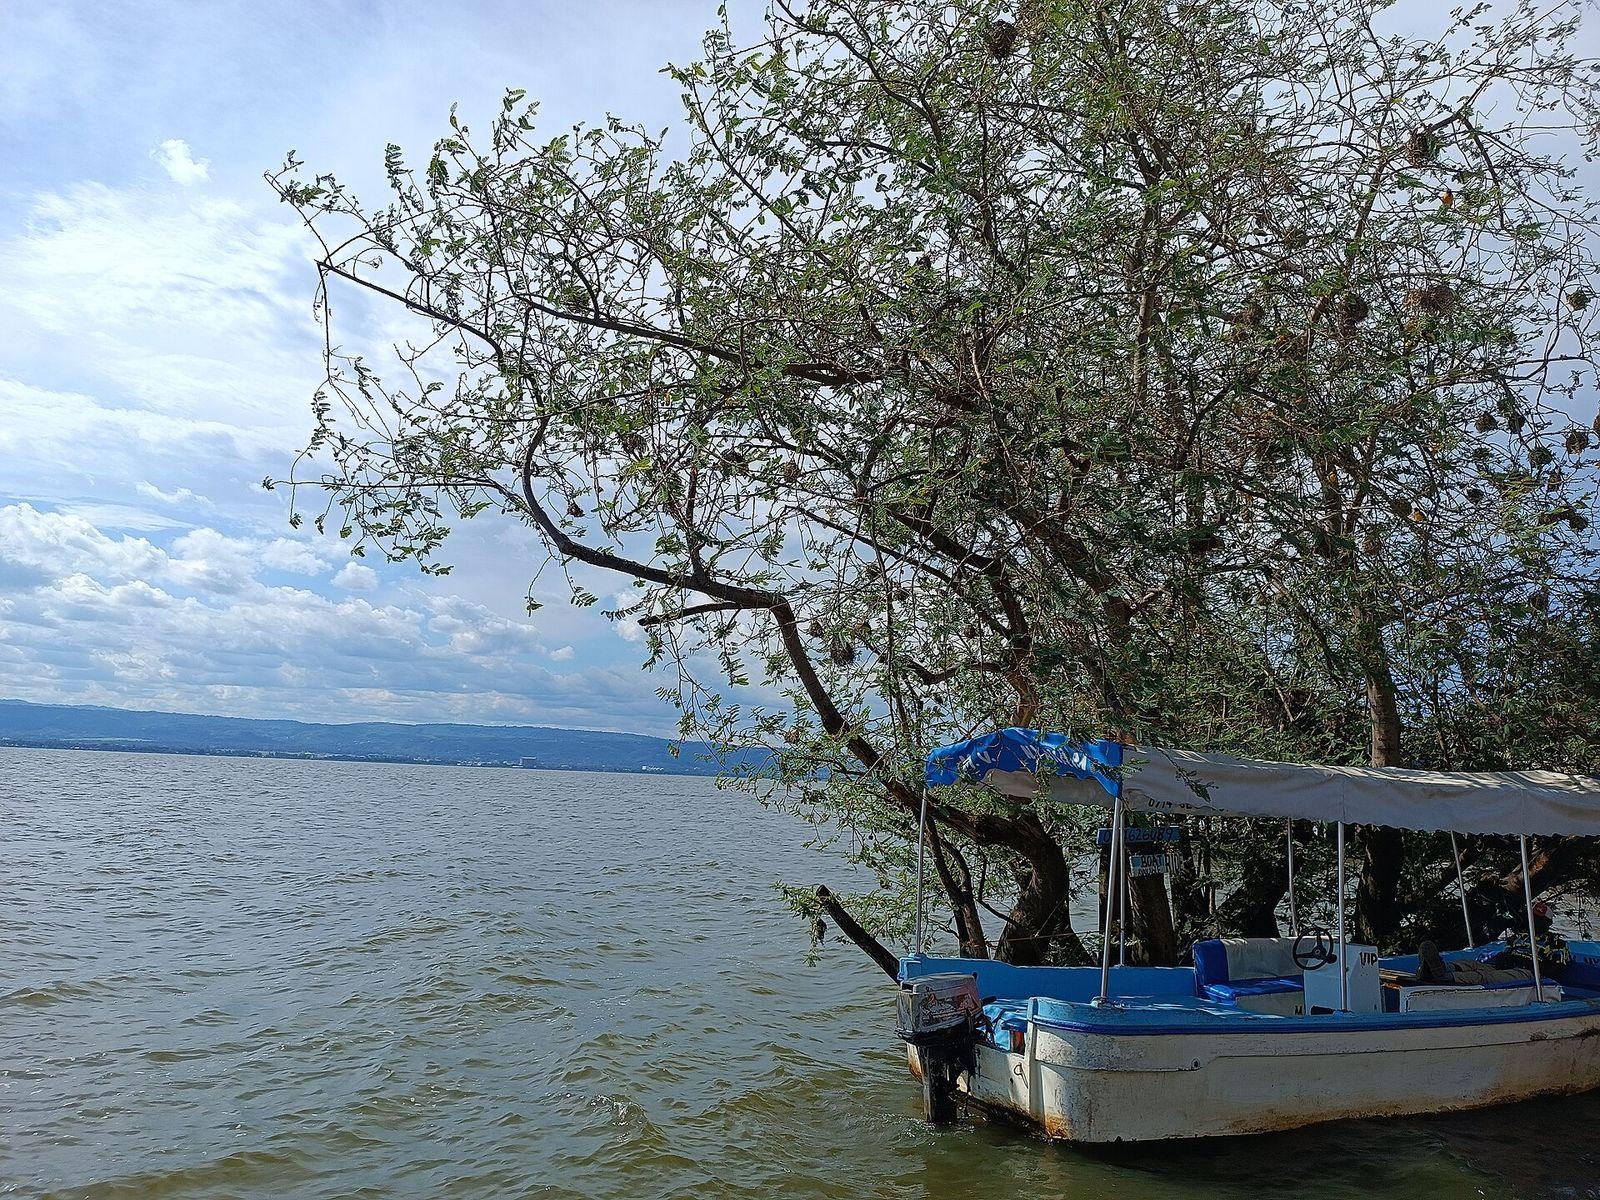
Kisumu
Photo: Sanjib Chaudhary, CC BY-SA 4.0, via Wikimedia Commons (resized)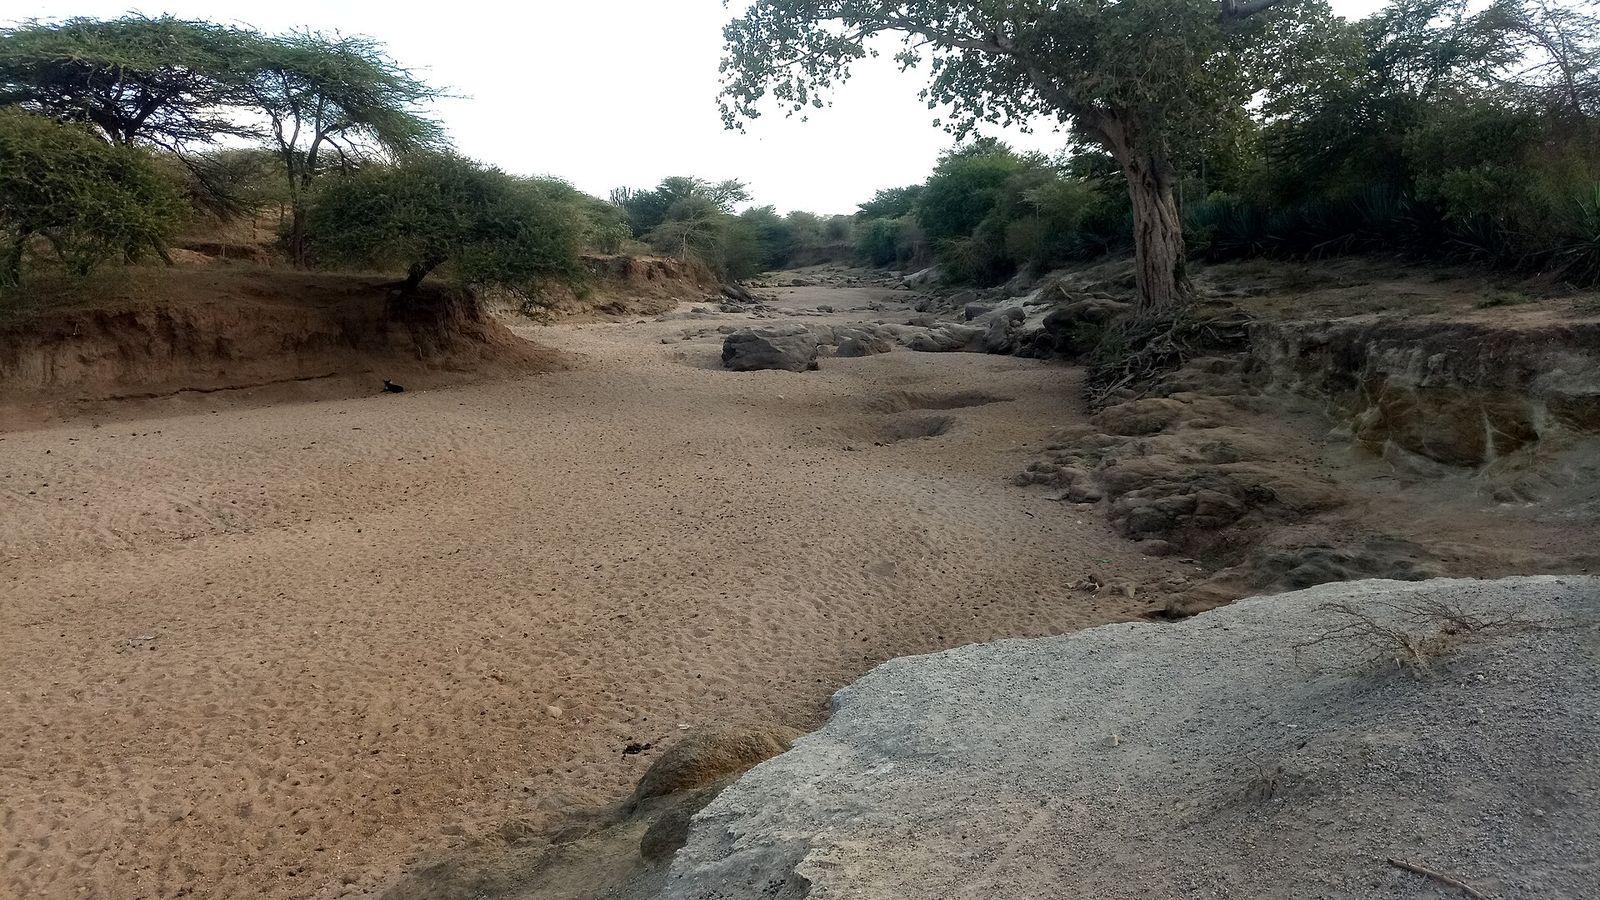
Kitui
Photo: John Nguru Kamau, CC BY-SA 4.0, via Wikimedia Commons (resized)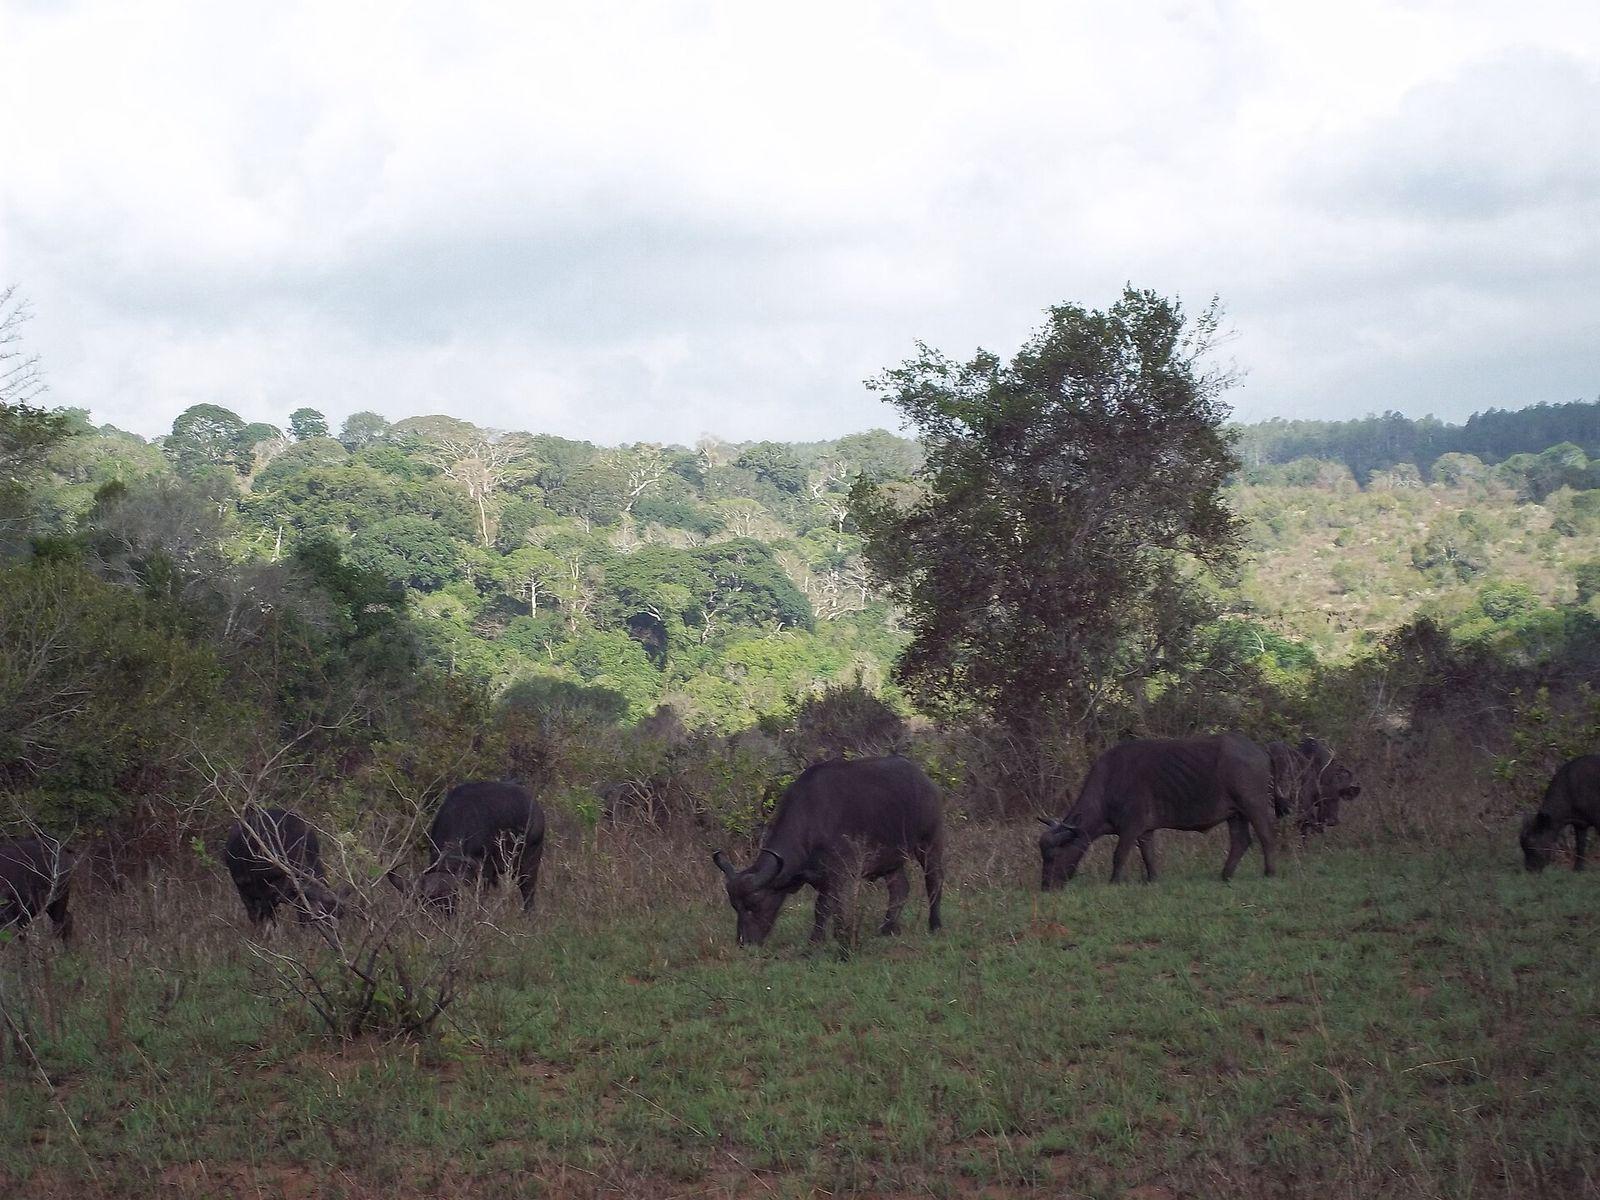
Kwale
Photo: Holger Günther, CC BY-SA 3.0, via Wikimedia Commons (resized)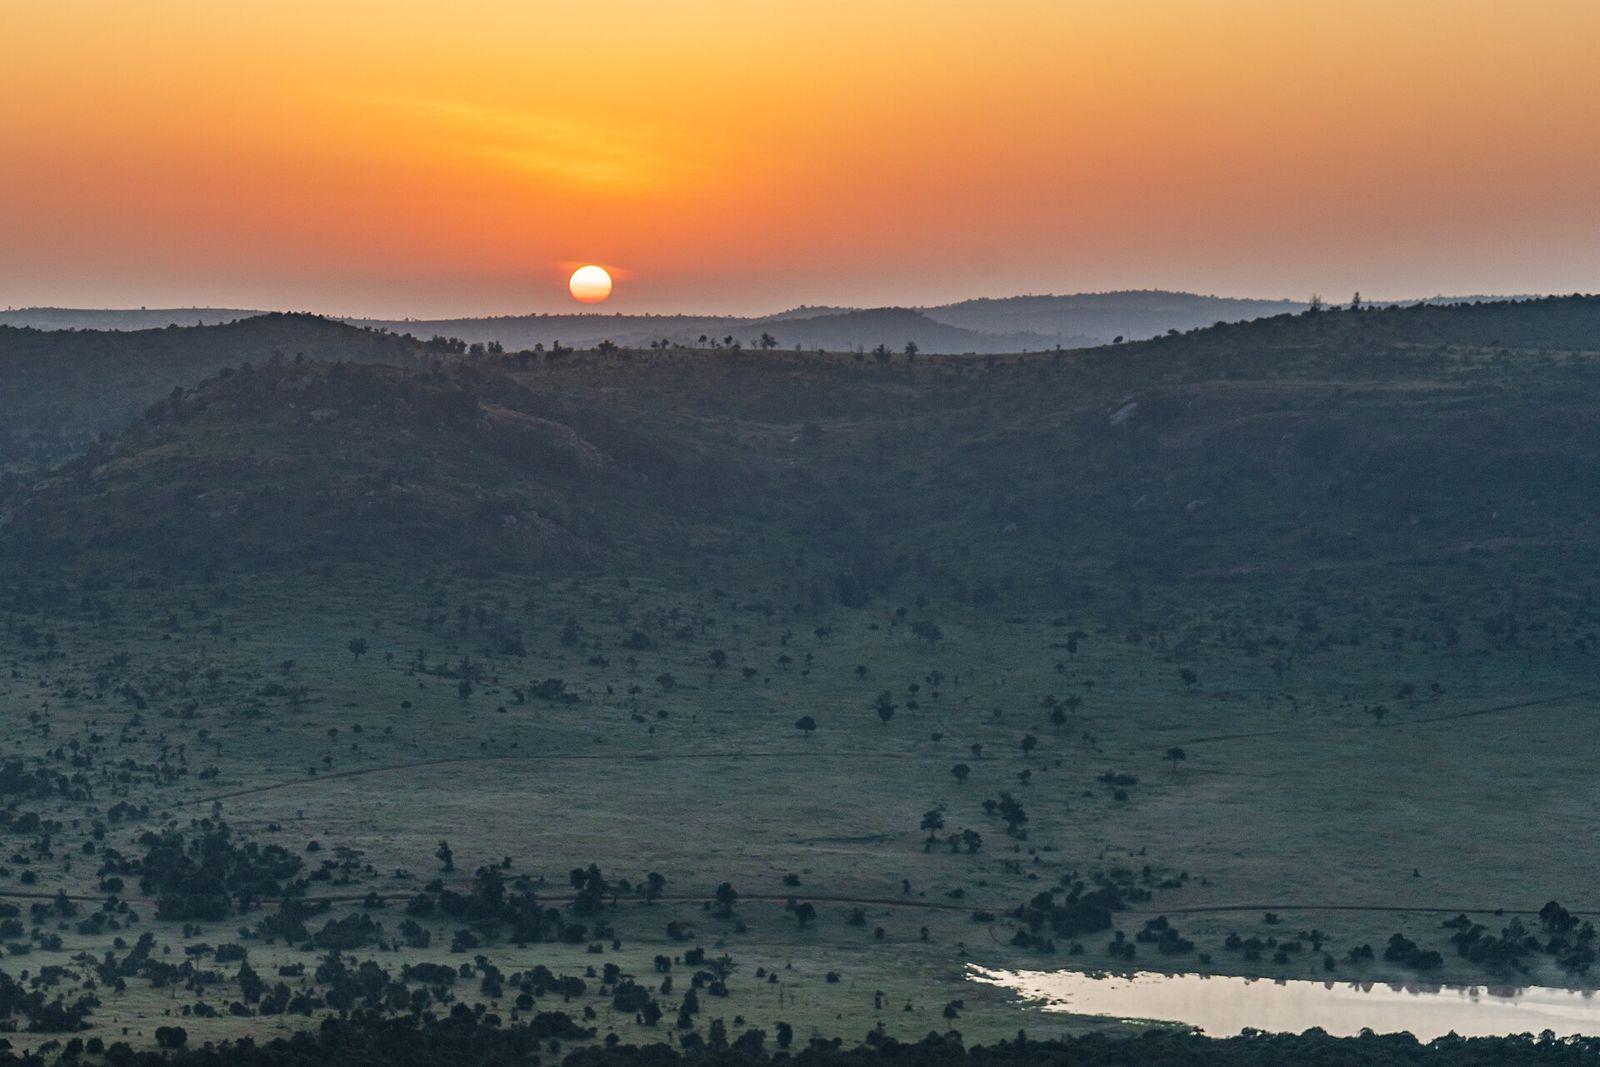
Laikipia
Photo: Nina R from Africa, CC BY 2.0, via Wikimedia Commons (resized)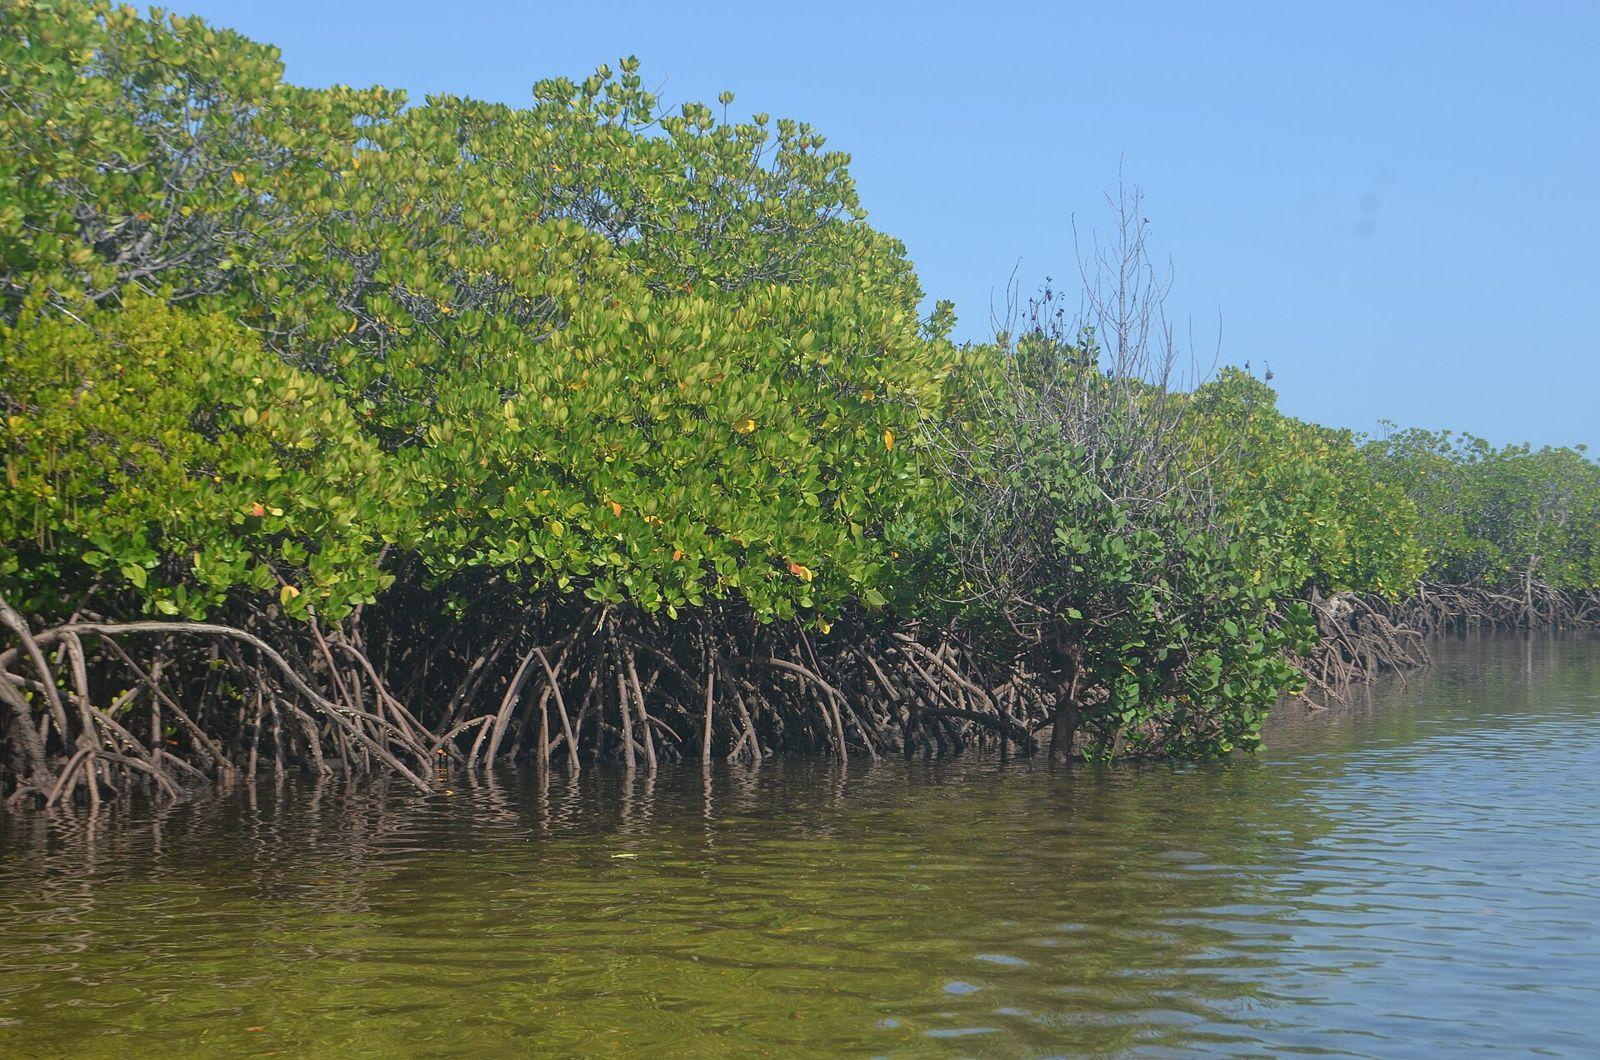
Lamu
Photo: Esha2022, CC BY-SA 4.0, via Wikimedia Commons (resized)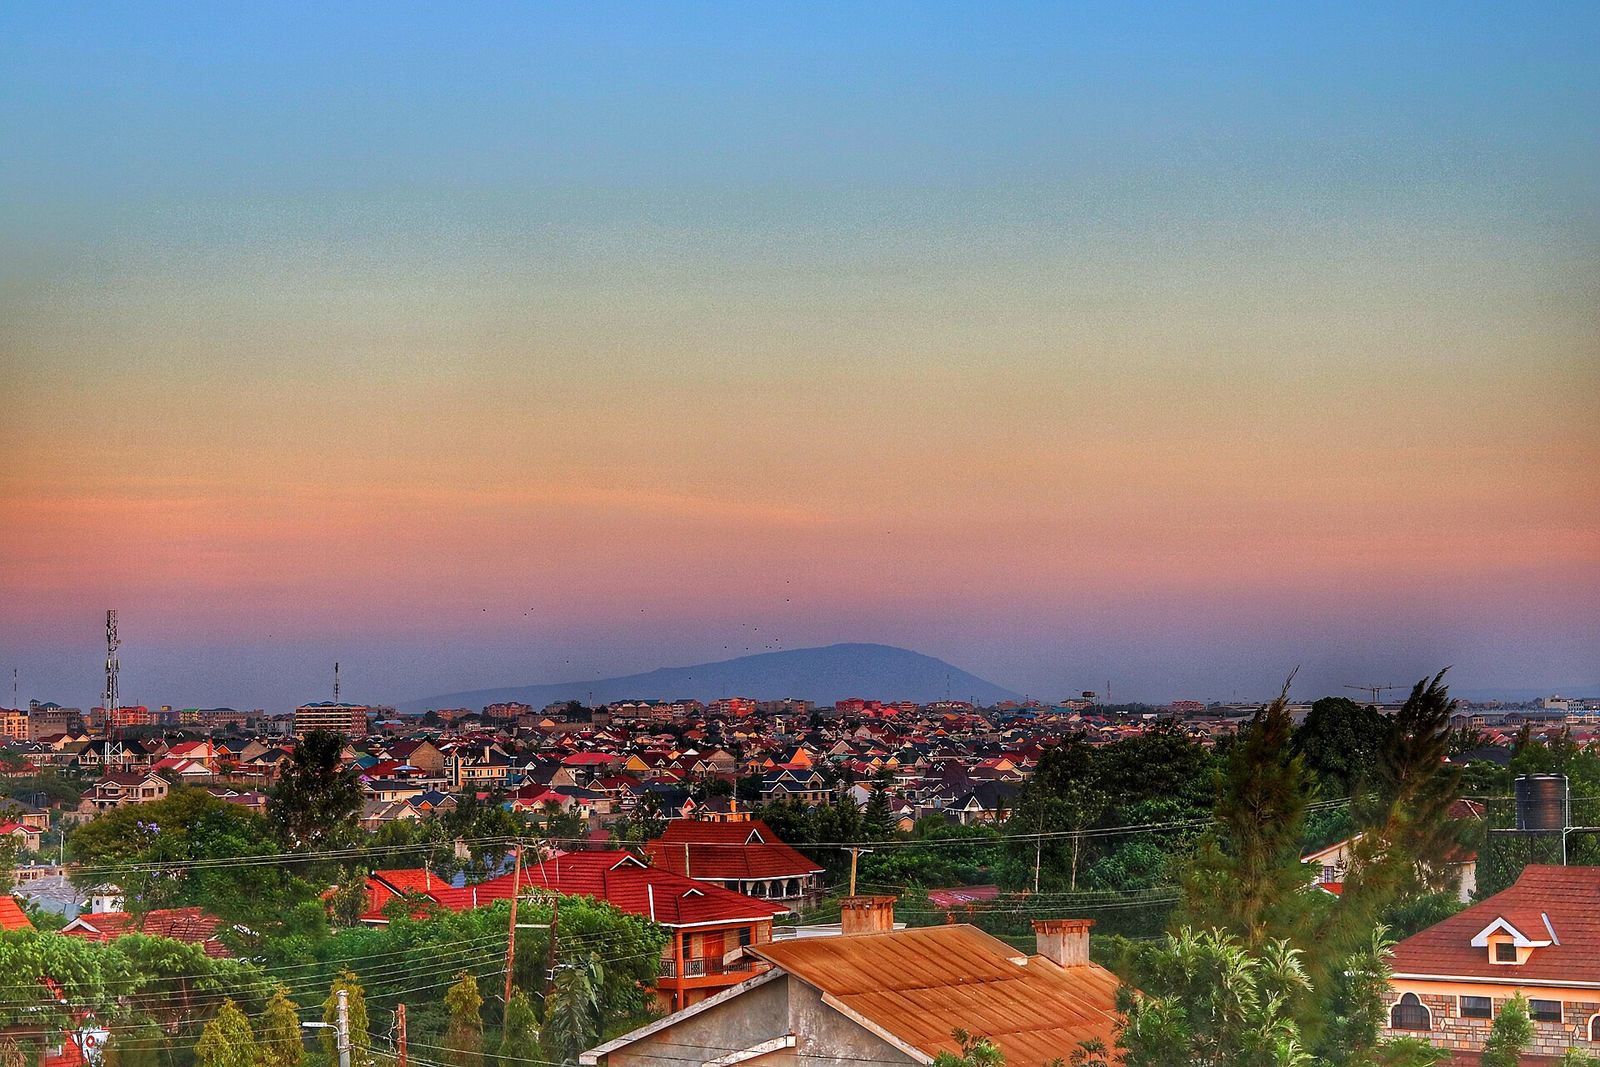
Machakos
Photo: William Mescudi Kiarie, CC0, via Wikimedia Commons (resized)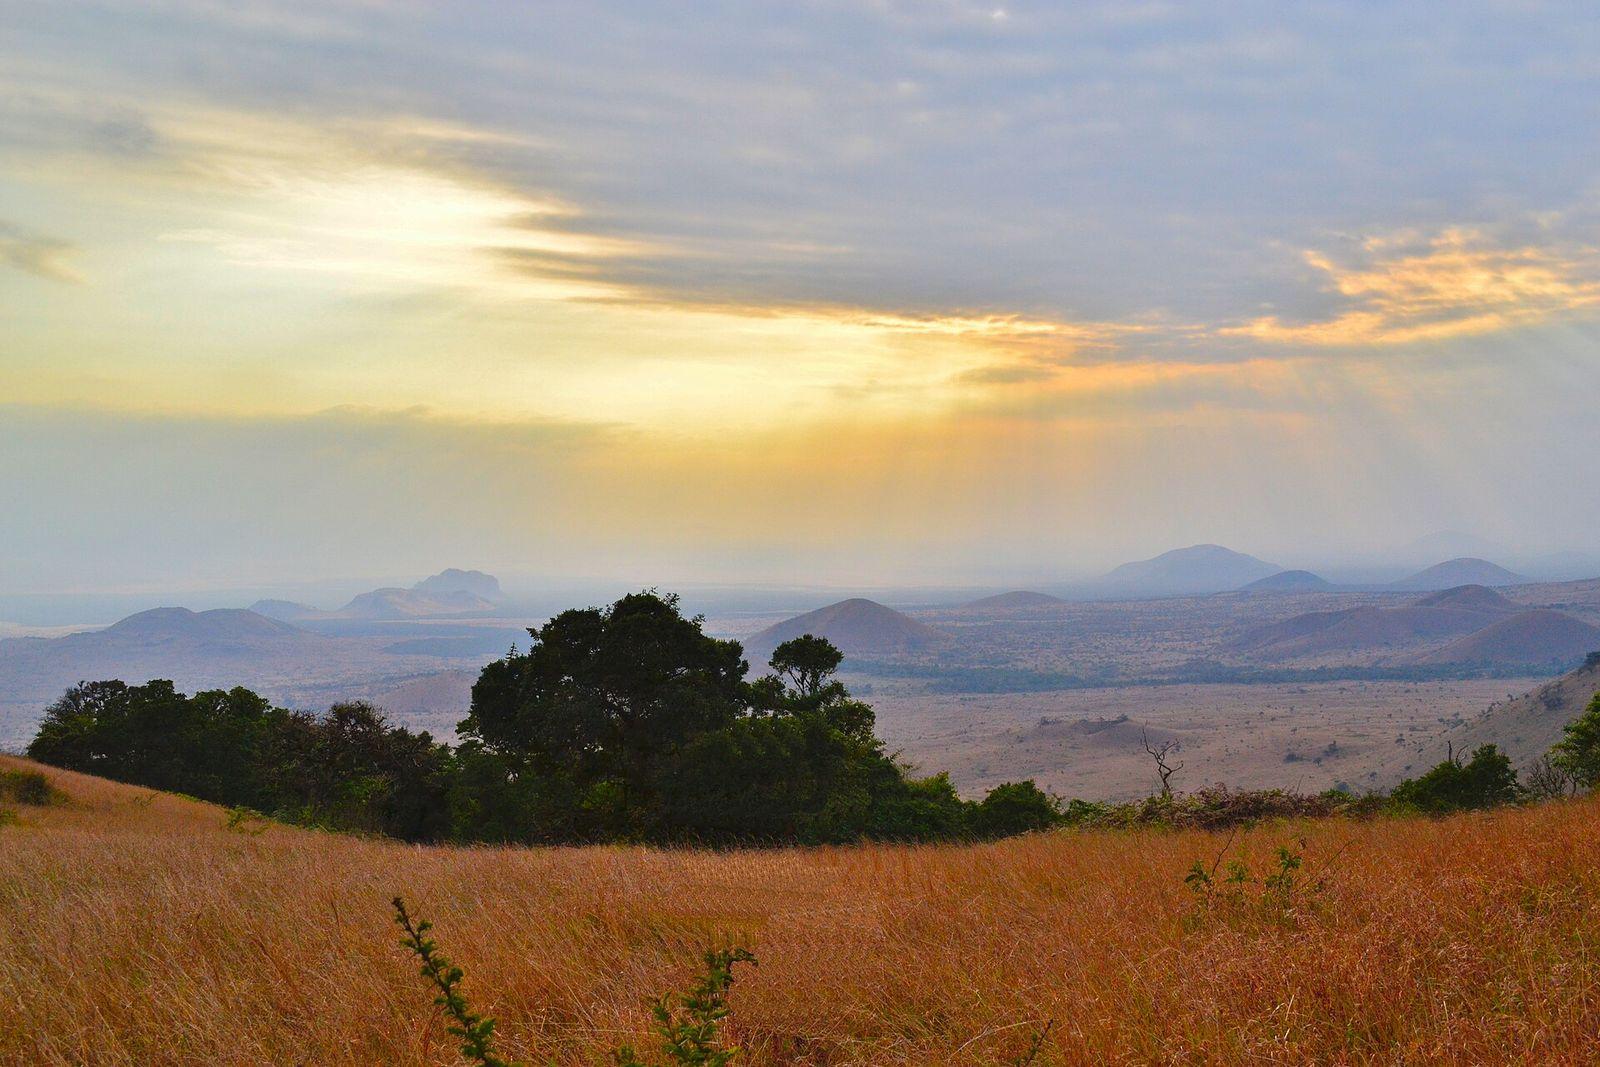
Makueni
Photo: Sho Hatakeyama, CC0, via Wikimedia Commons (resized)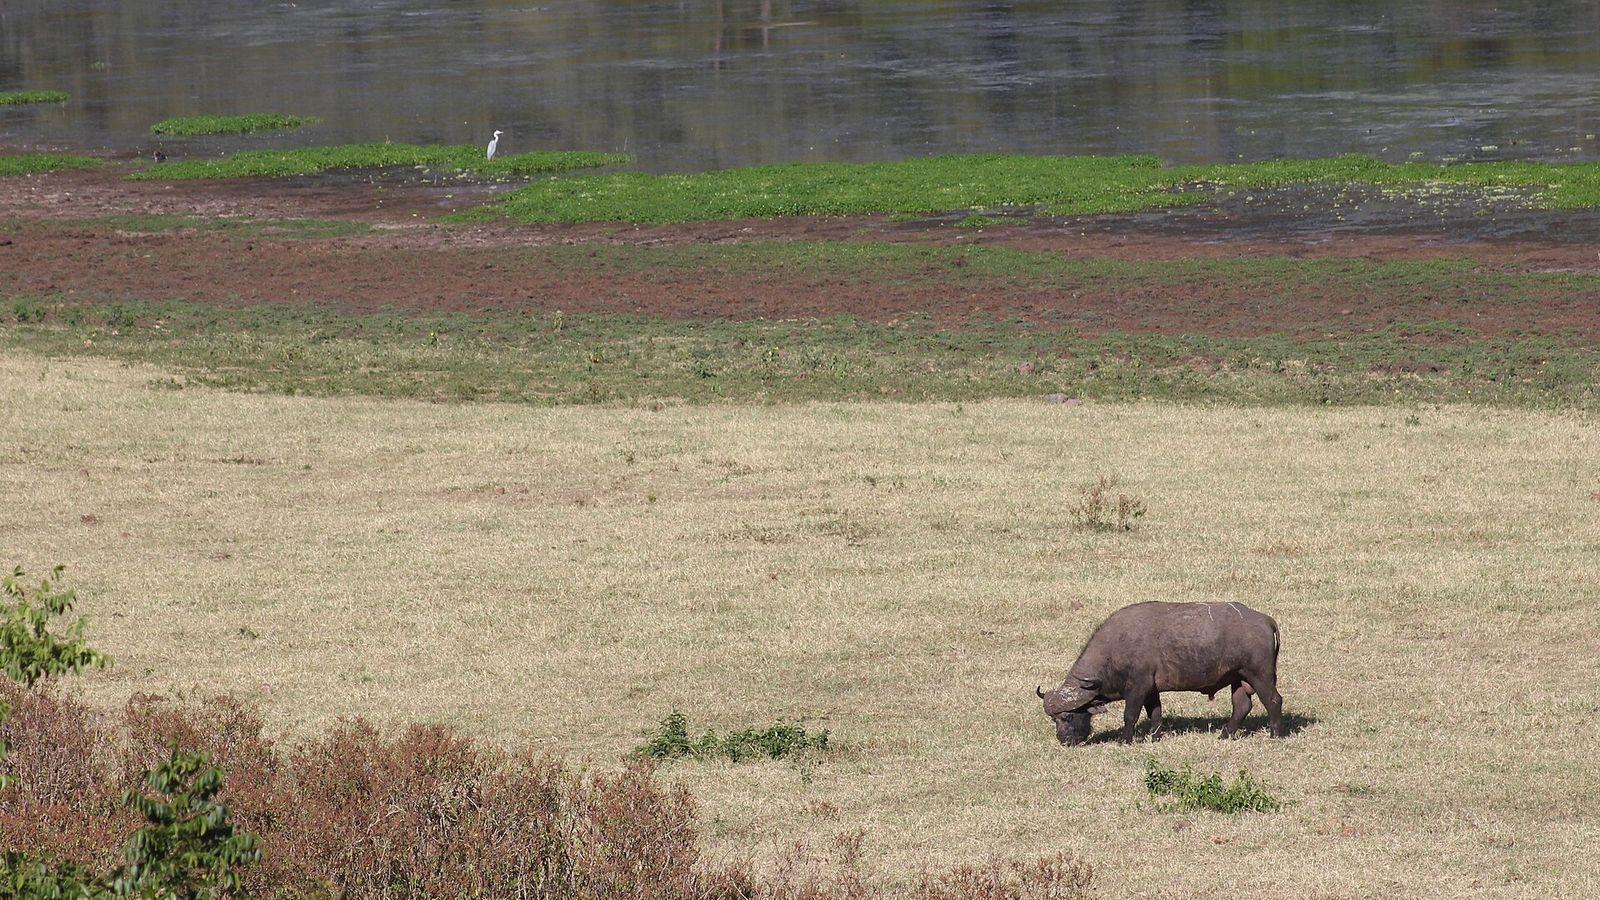
Marsabit
Photo: Nagarjun, CC BY 2.0, via Wikimedia Commons (resized)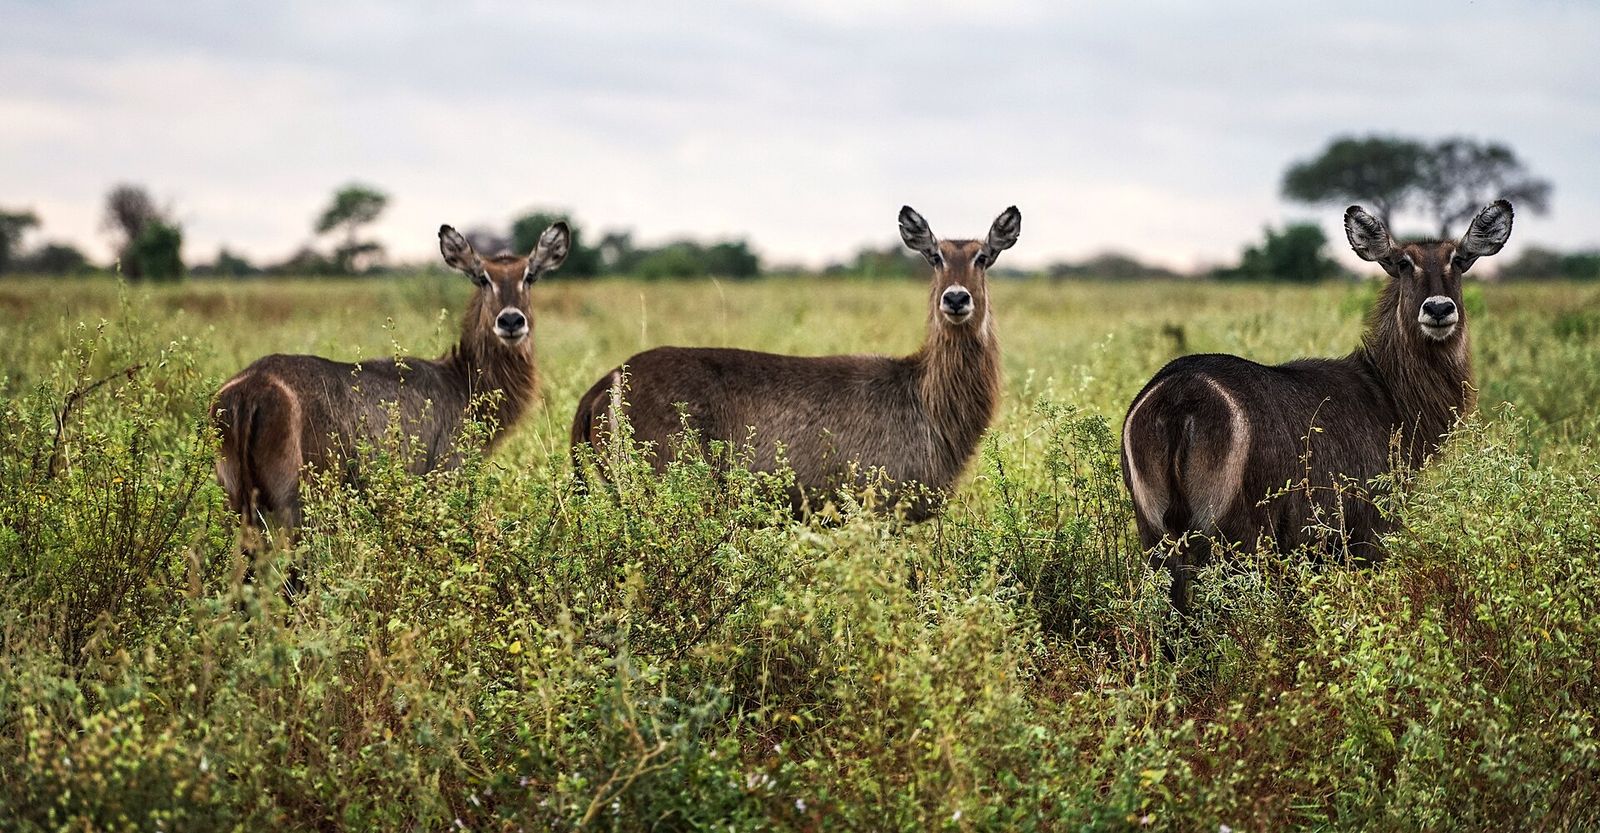
Meru
Photo: Nina R, CC BY 2.0, via Wikimedia Commons (resized)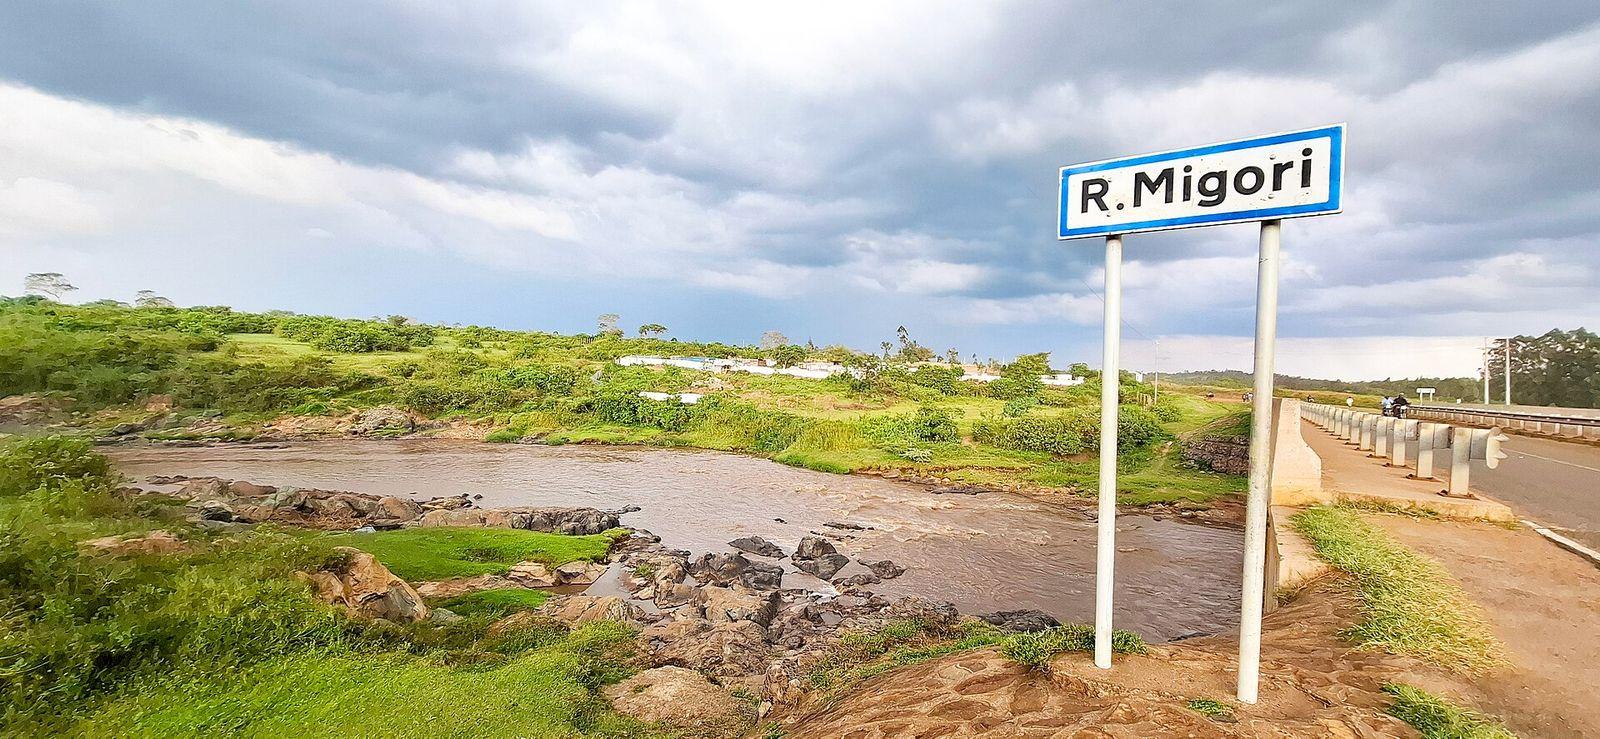
Migori
Photo: Queen Asali, CC0, via Wikimedia Commons (resized)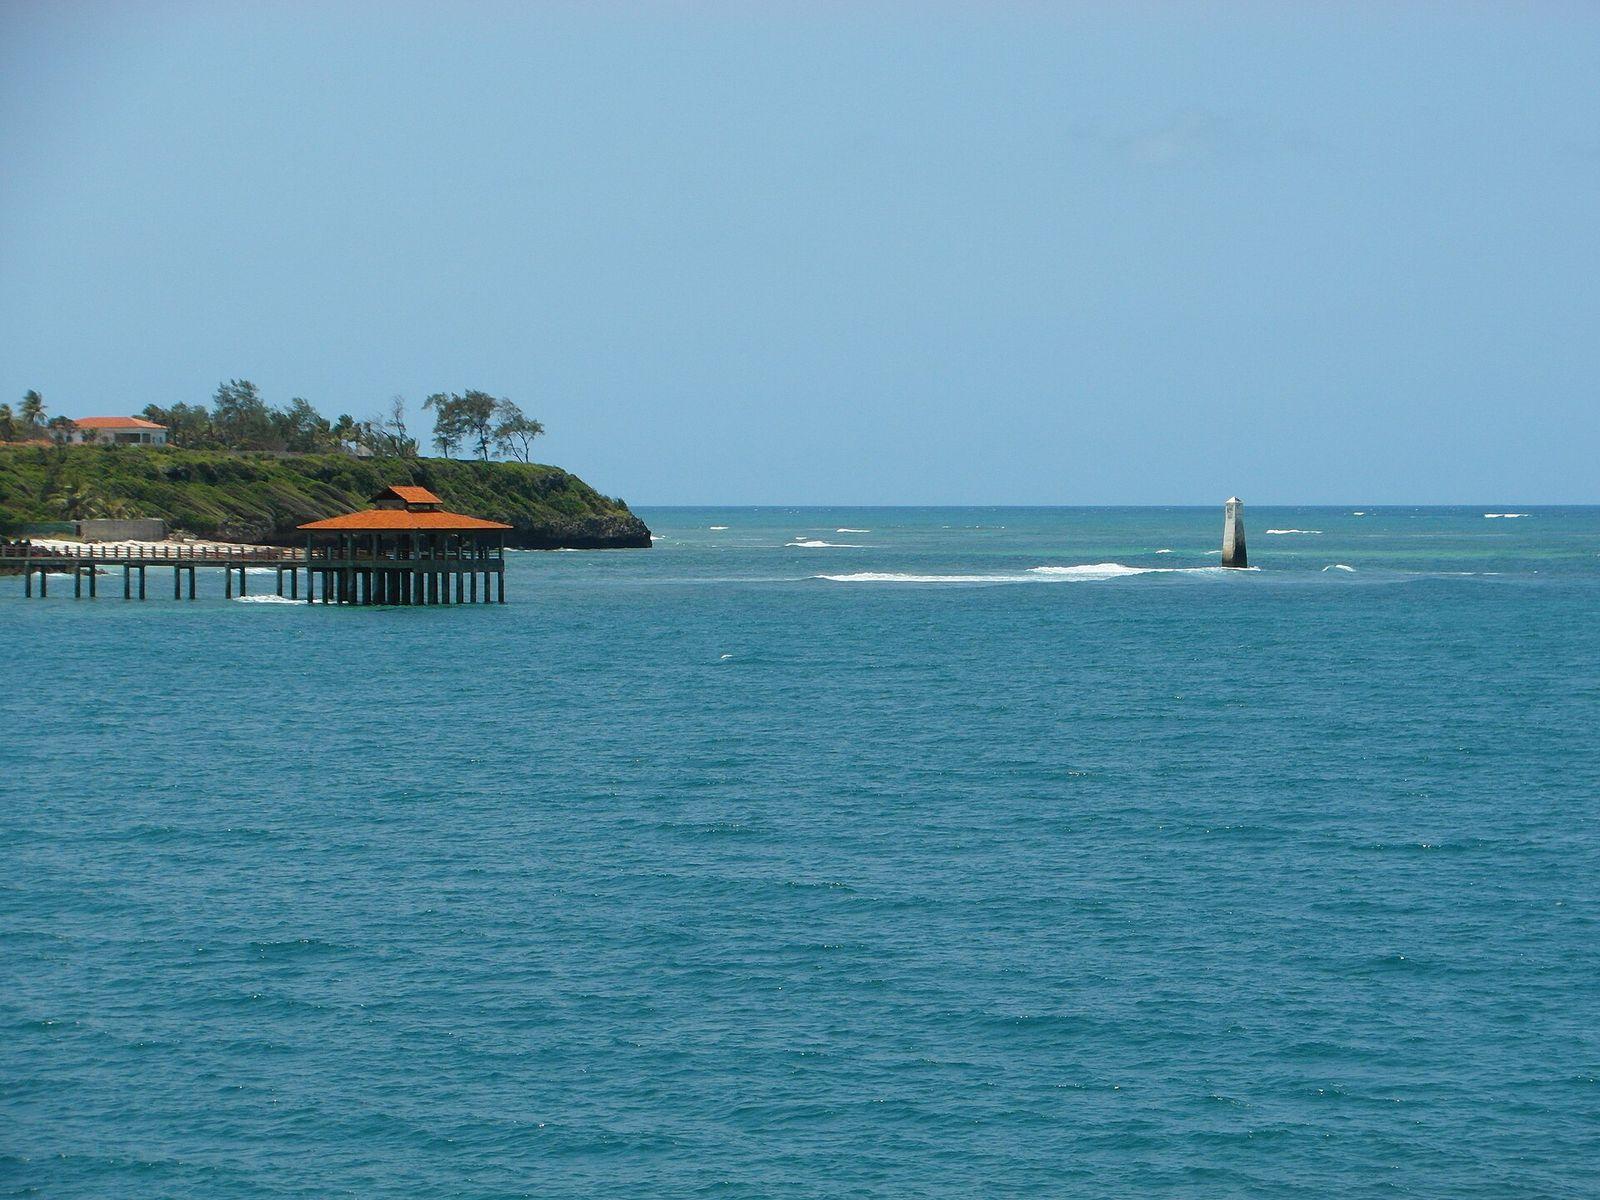
Mombasa
Photo: Roma Neus, CC BY 3.0, via Wikimedia Commons (resized)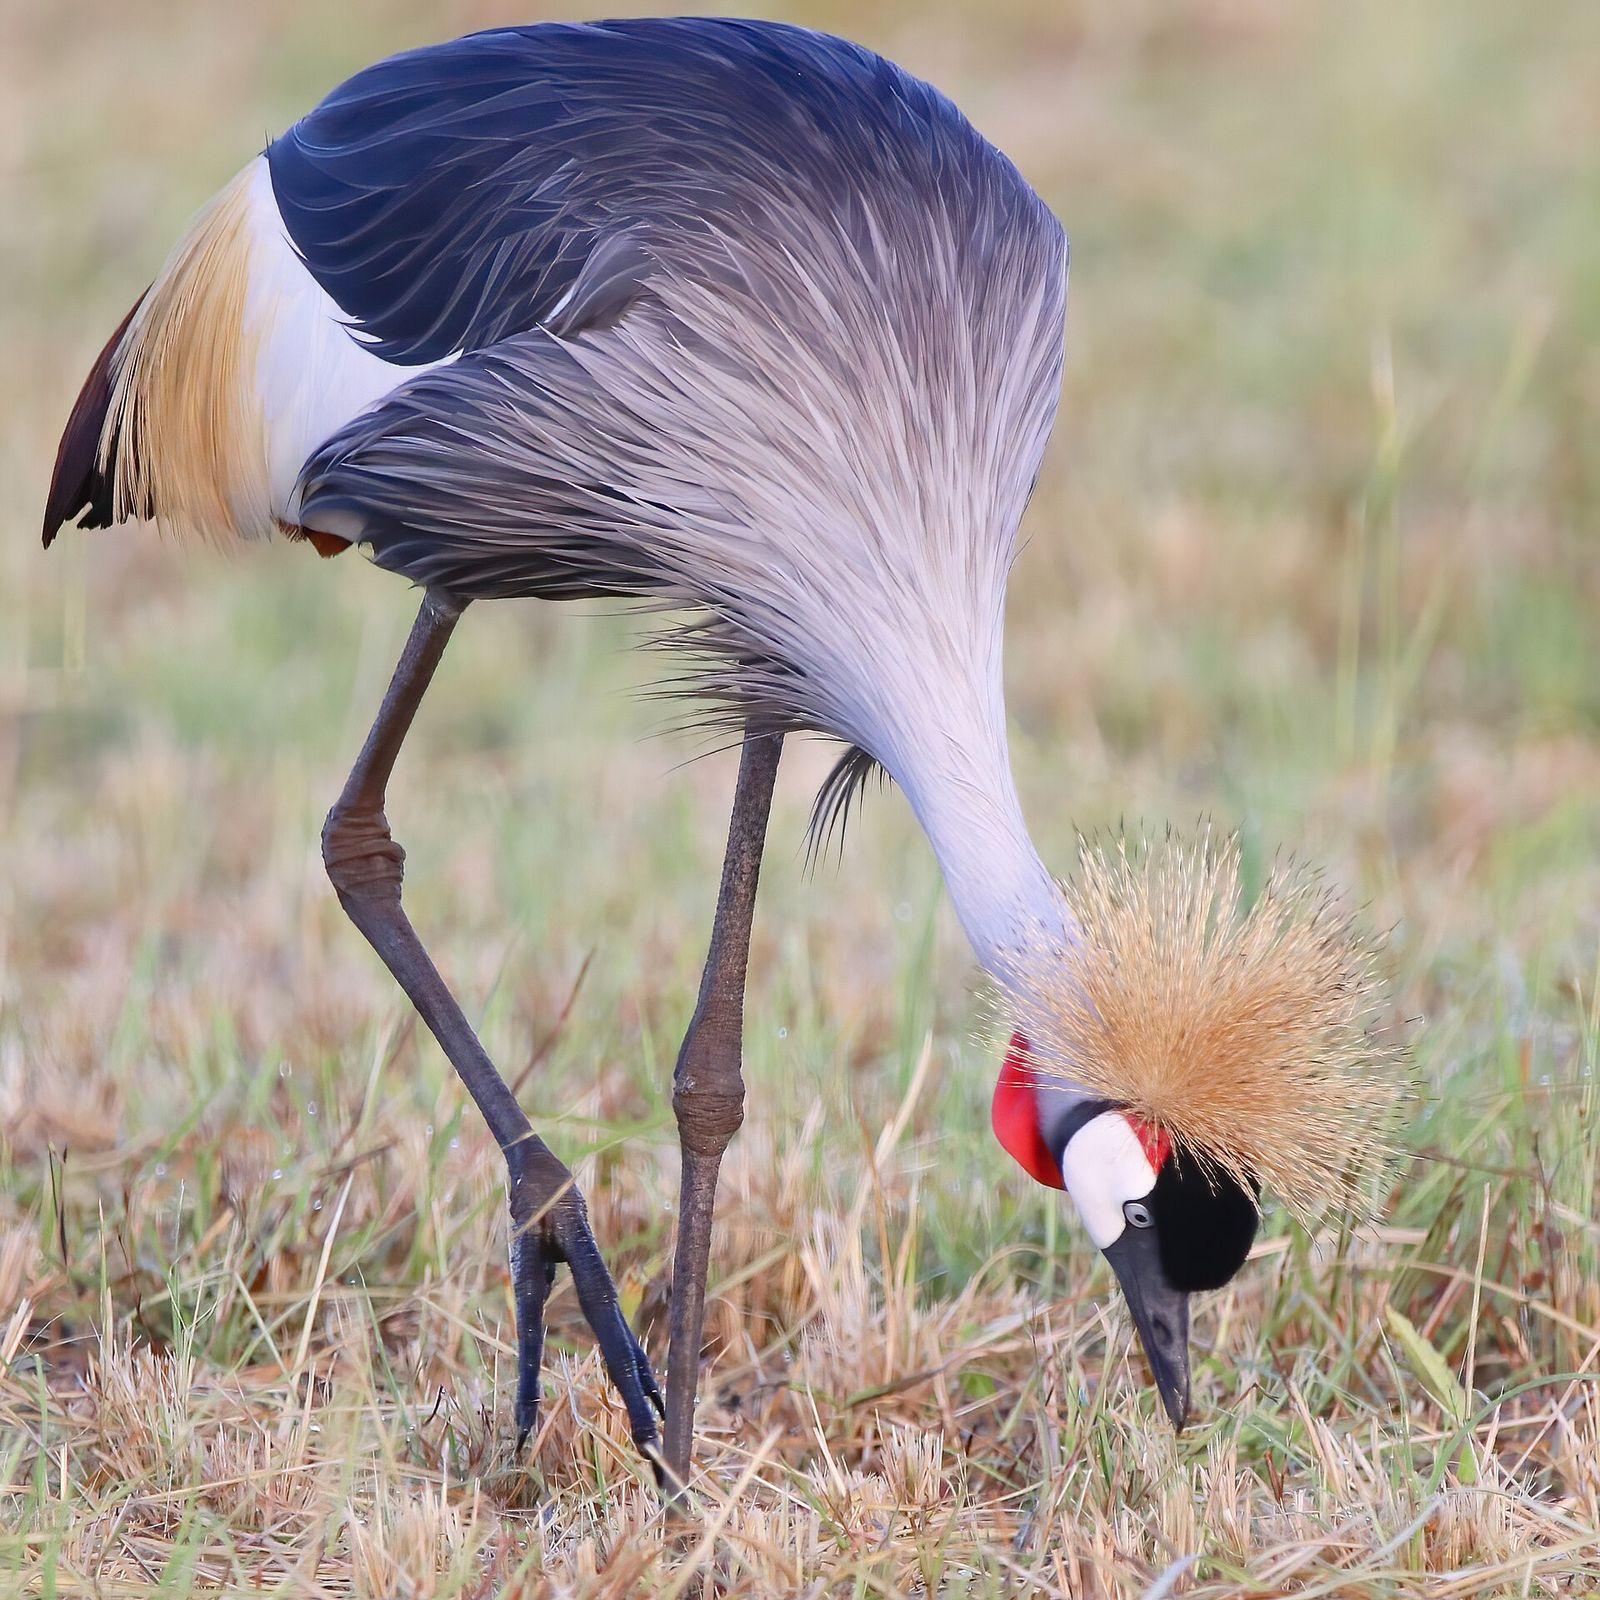
Murang'a
Photo: Kenyanbirder, CC BY-SA 4.0, via Wikimedia Commons (resized)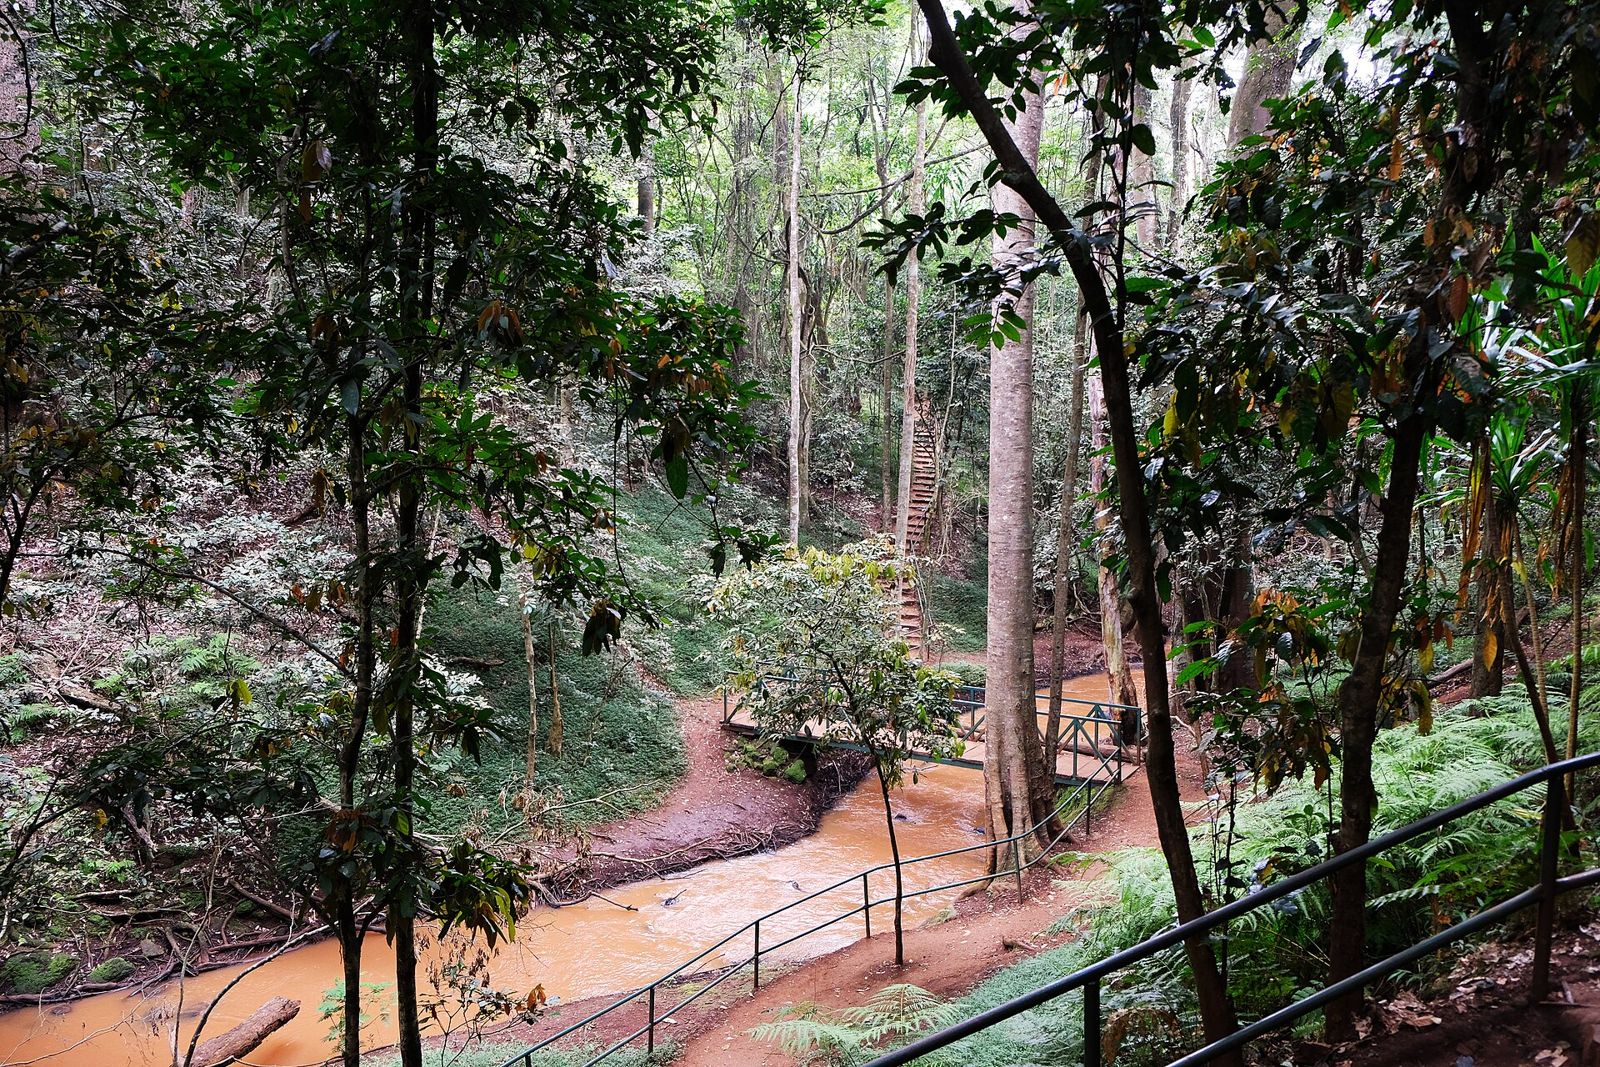
Nairobi
Photo: Kaethe17, CC BY 4.0, via Wikimedia Commons (resized)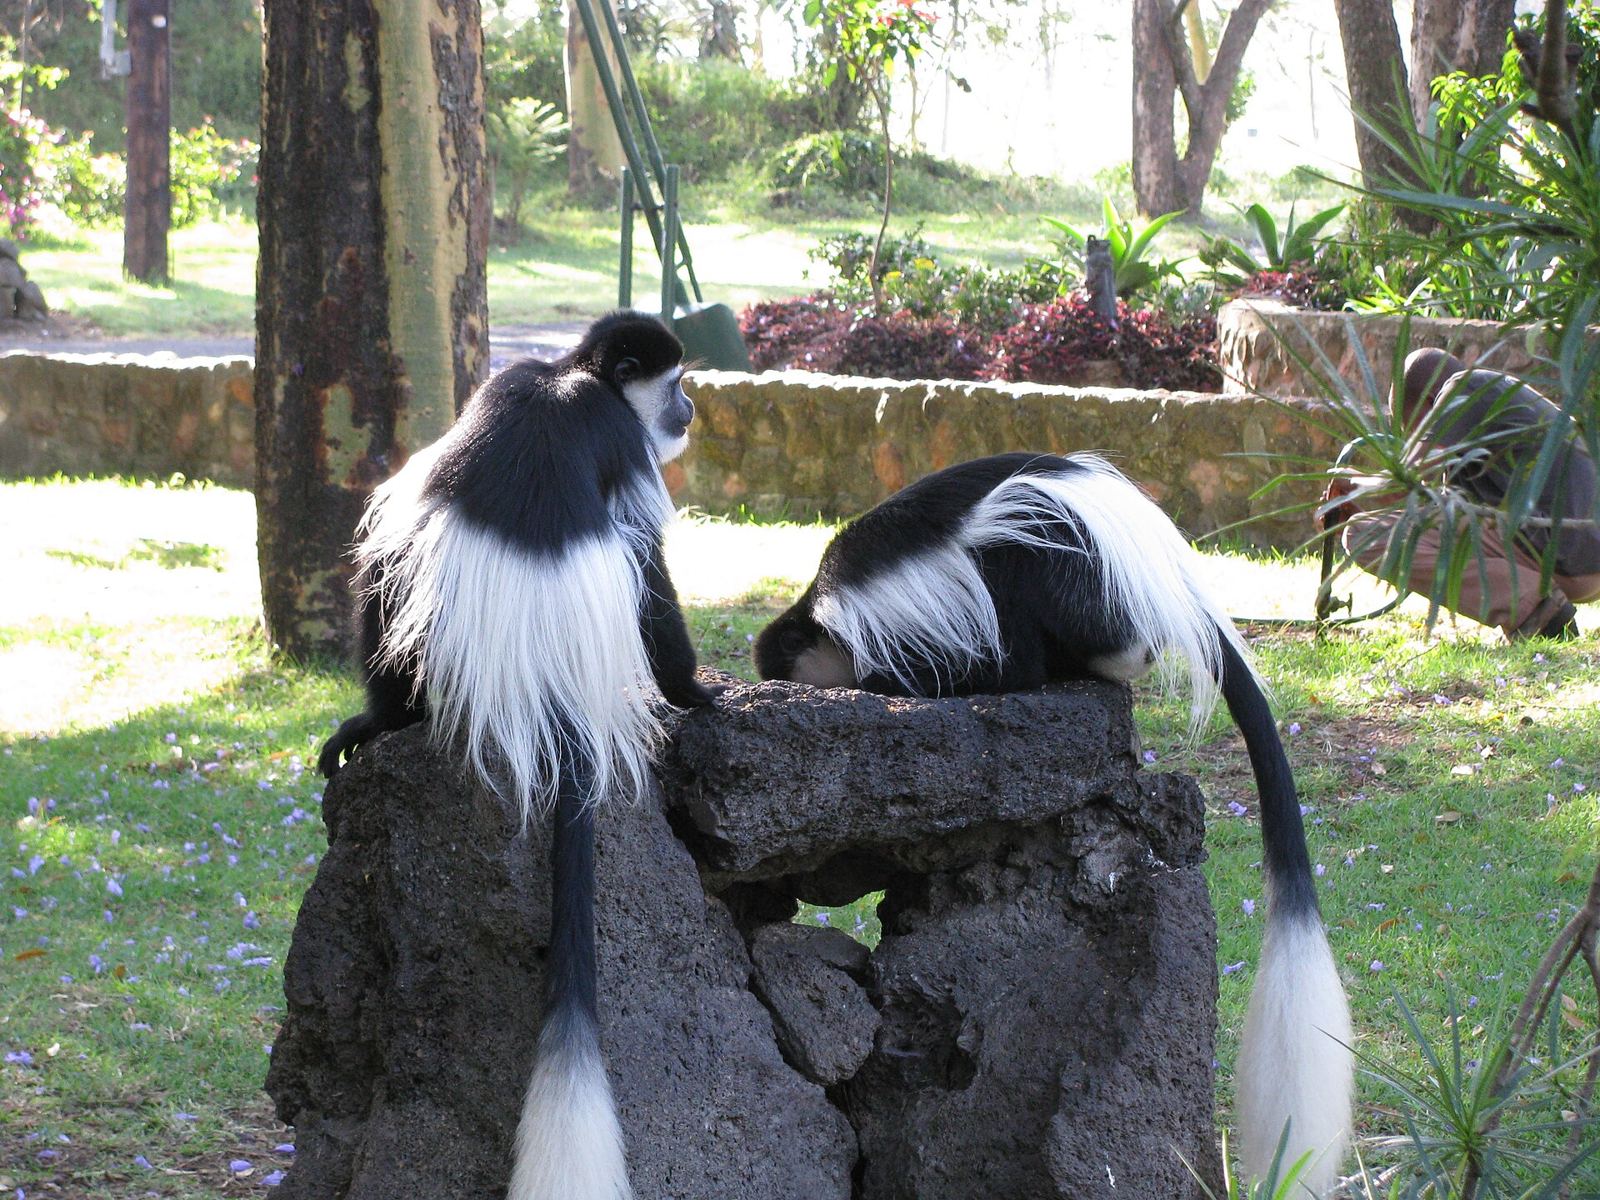
Nakuru
Photo: shankar s., CC BY 2.0, via Wikimedia Commons (resized)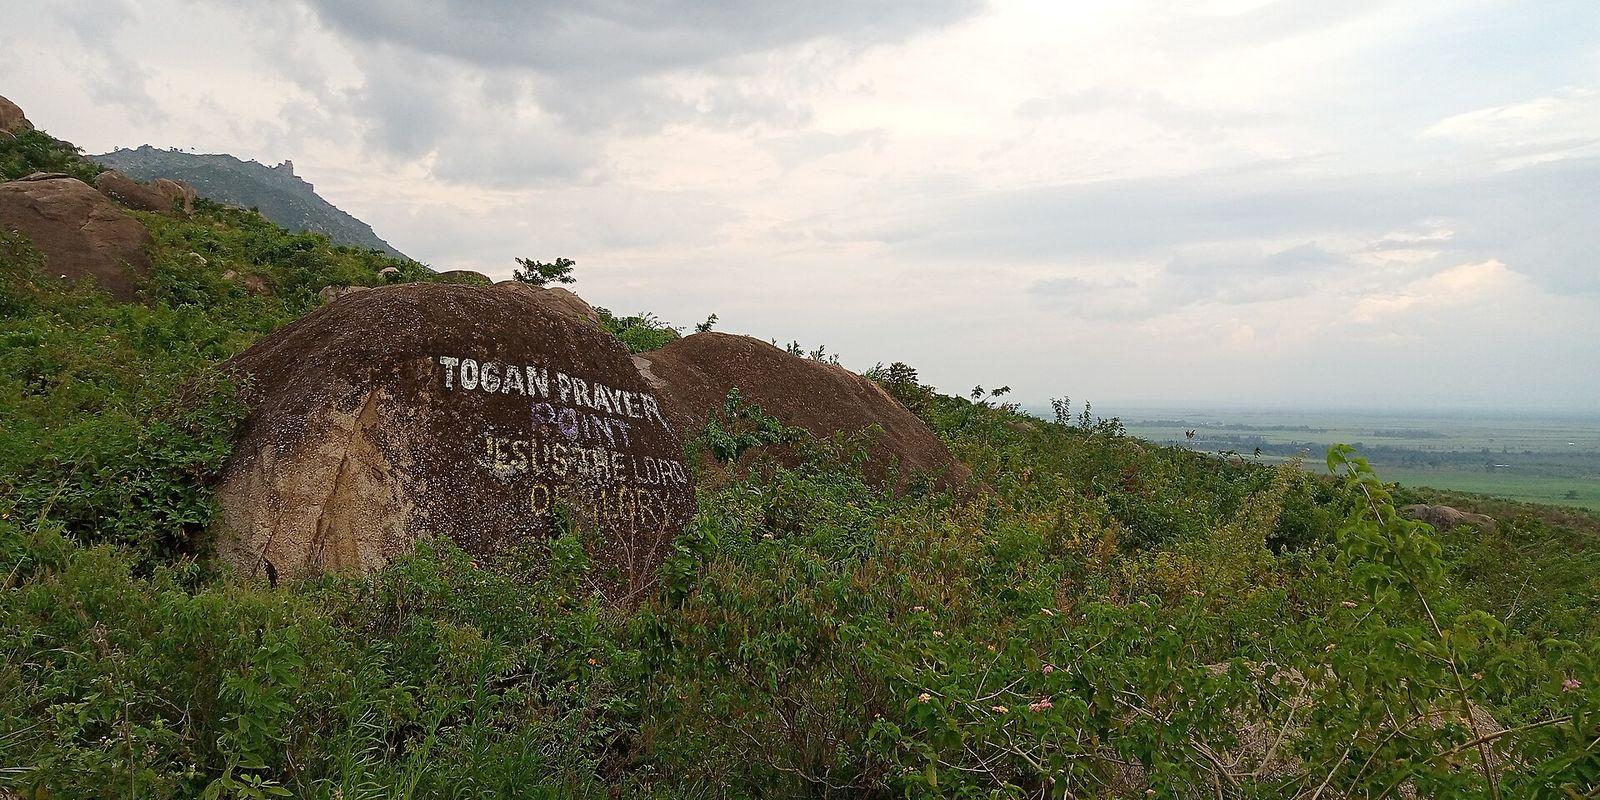
Nandi
Photo: Leviazr, CC BY-SA 4.0, via Wikimedia Commons (resized)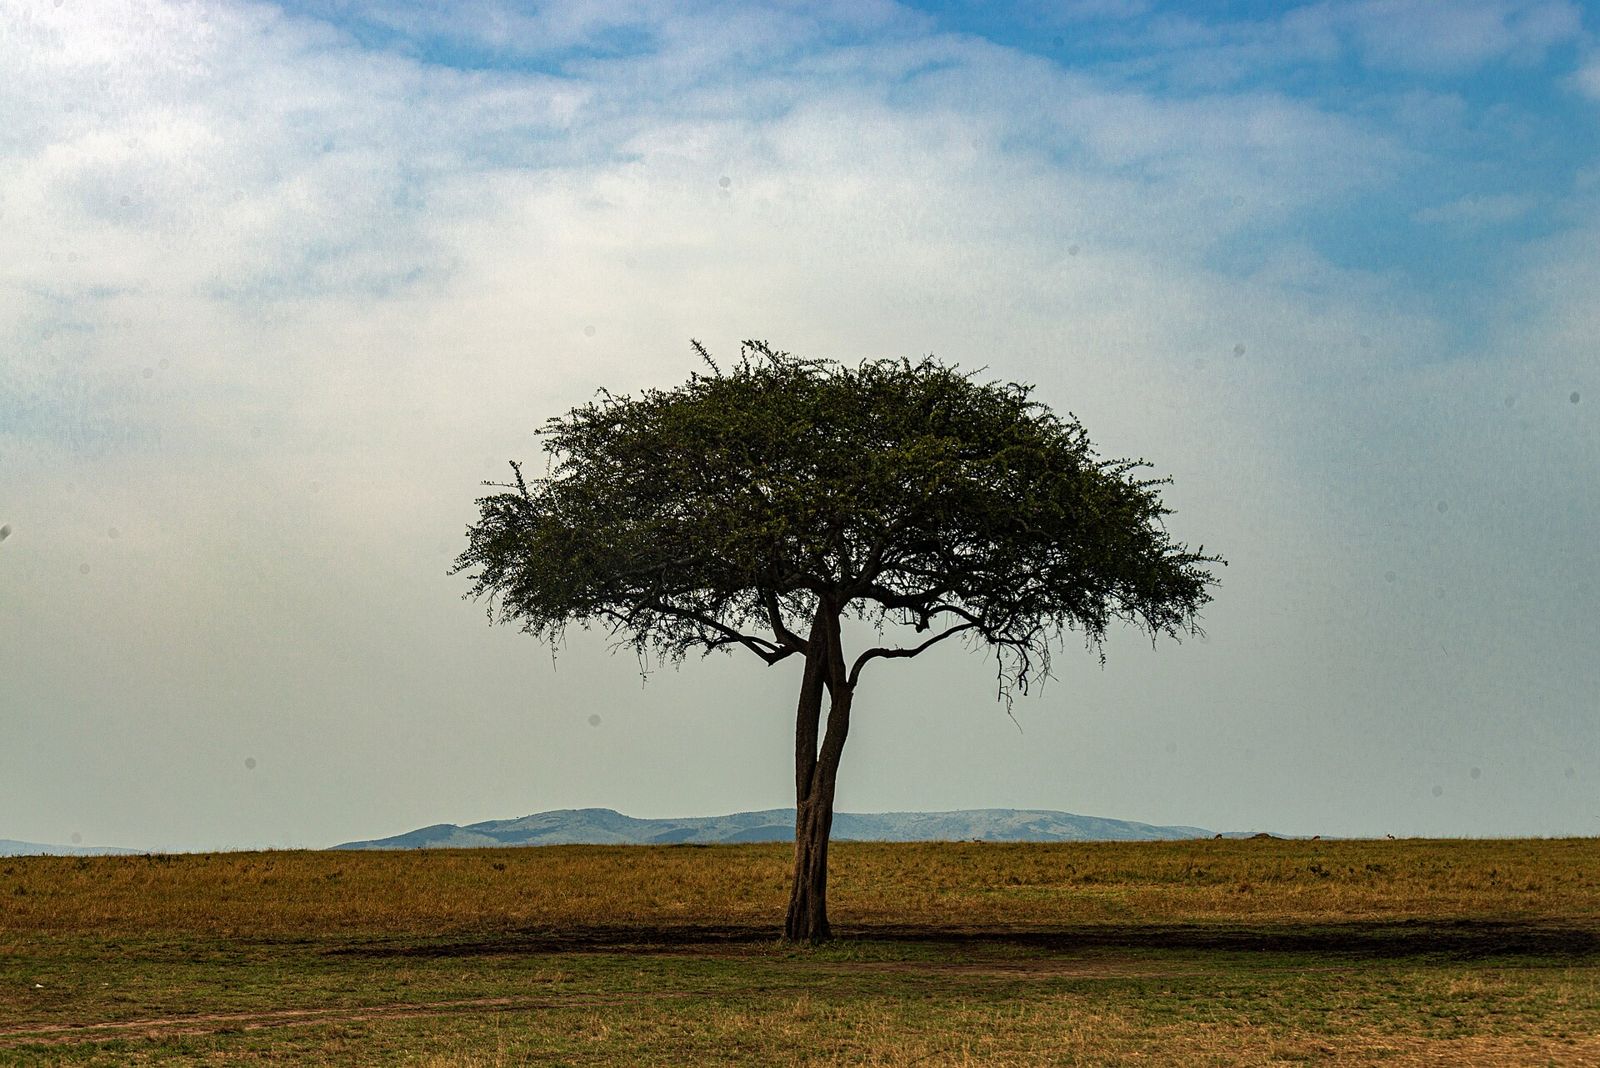
Narok
Photo: Daniel Case, CC BY-SA 4.0, via Wikimedia Commons (resized)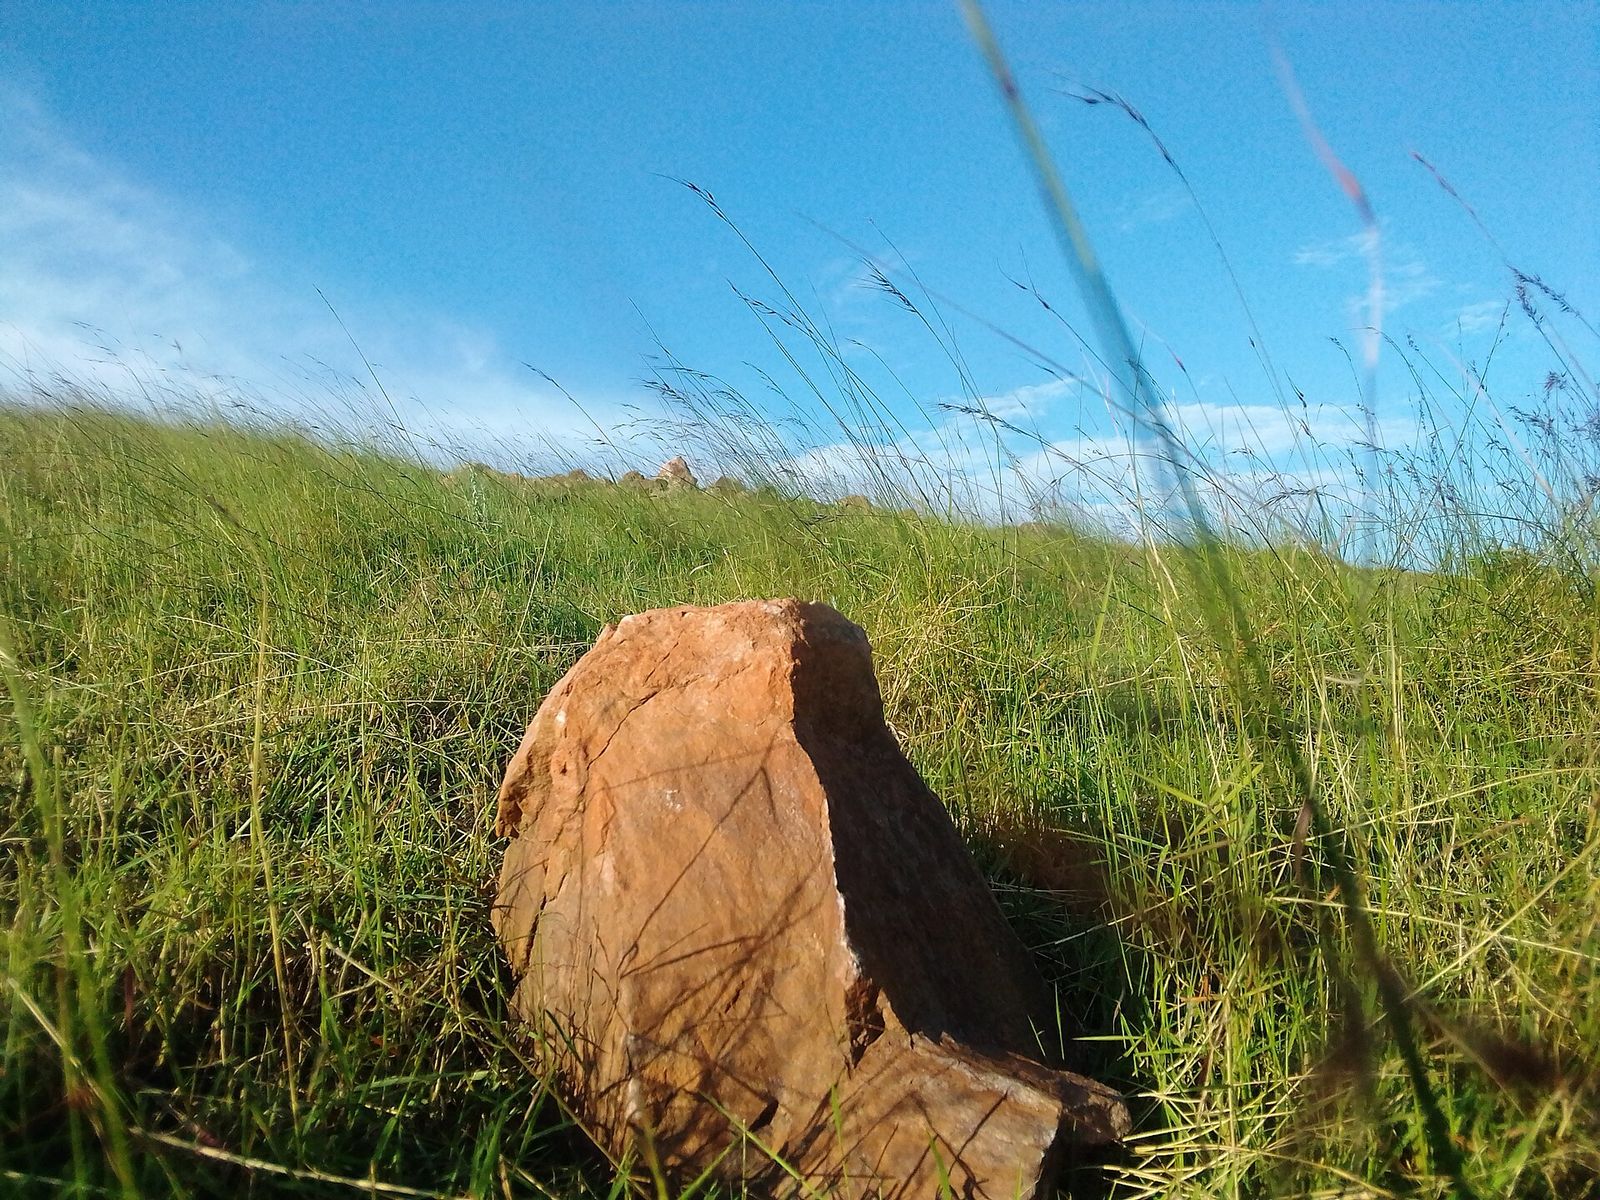
Nyamira
Photo: Moire Dr., CC BY-SA 4.0, via Wikimedia Commons (resized)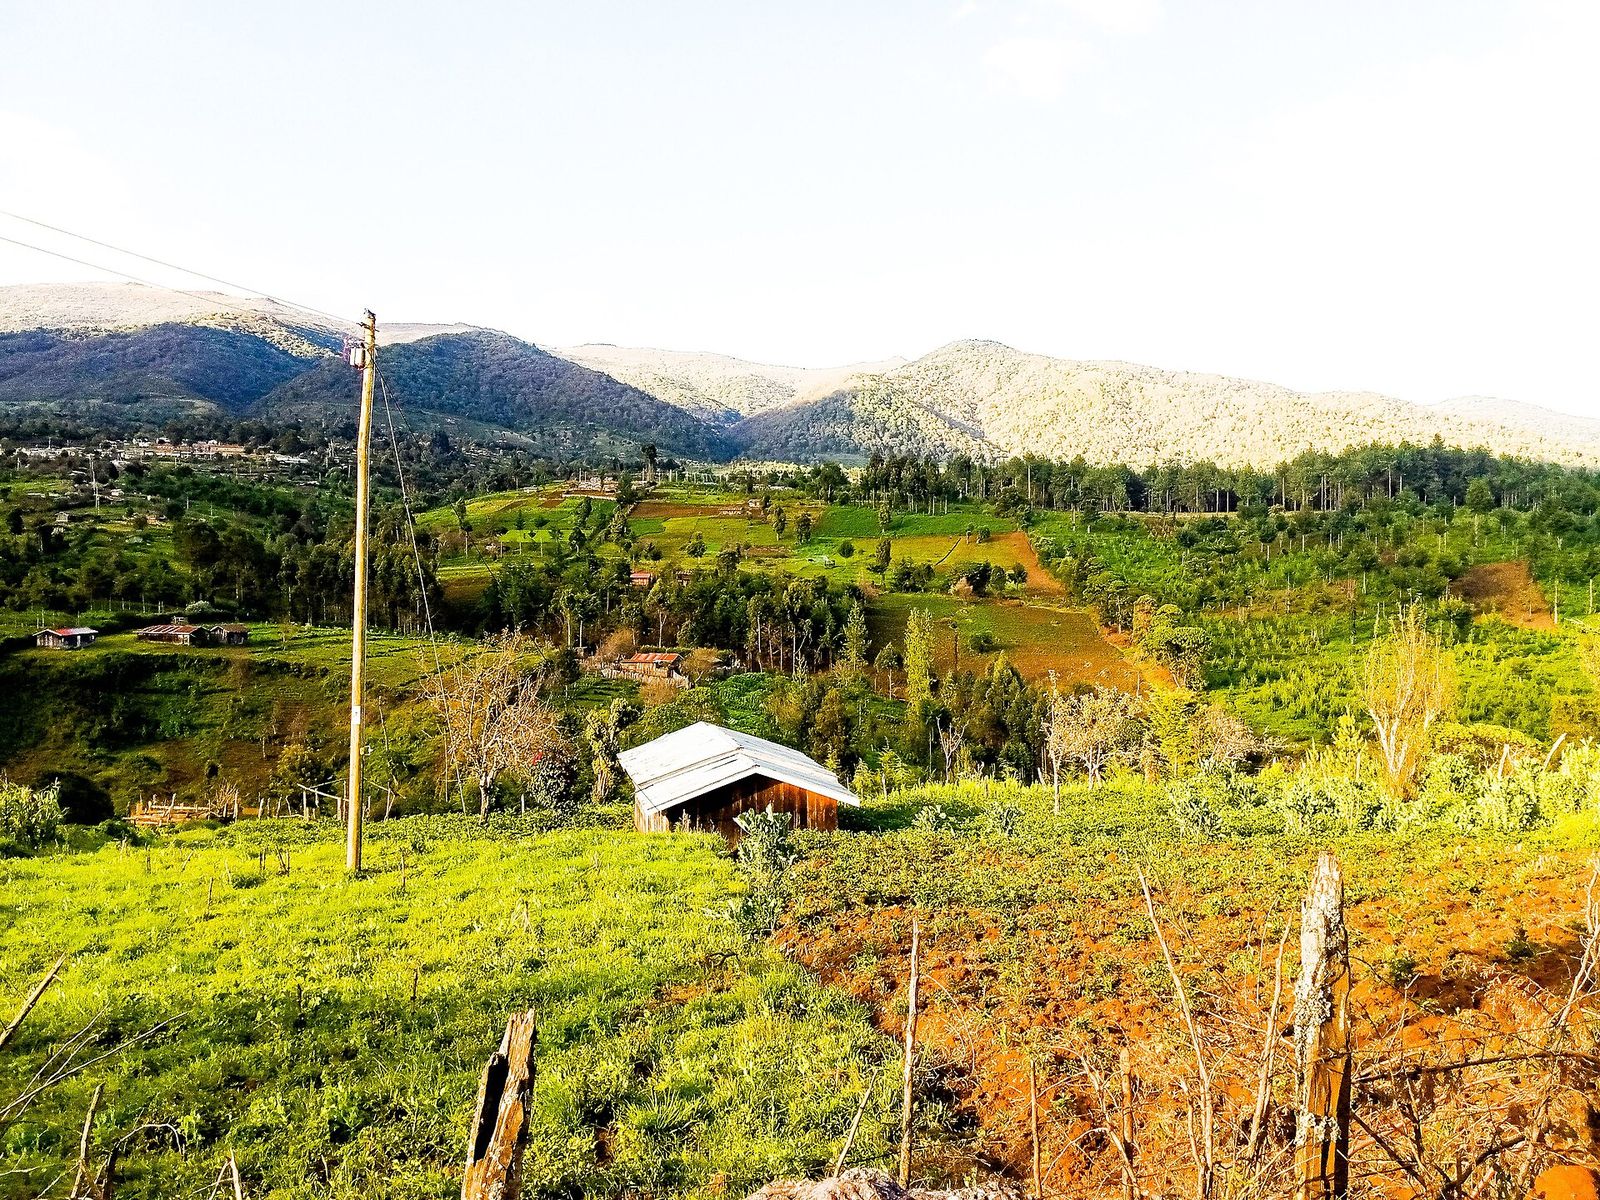
Nyandarua
Photo: WillieKariuki, CC BY-SA 4.0, via Wikimedia Commons (resized)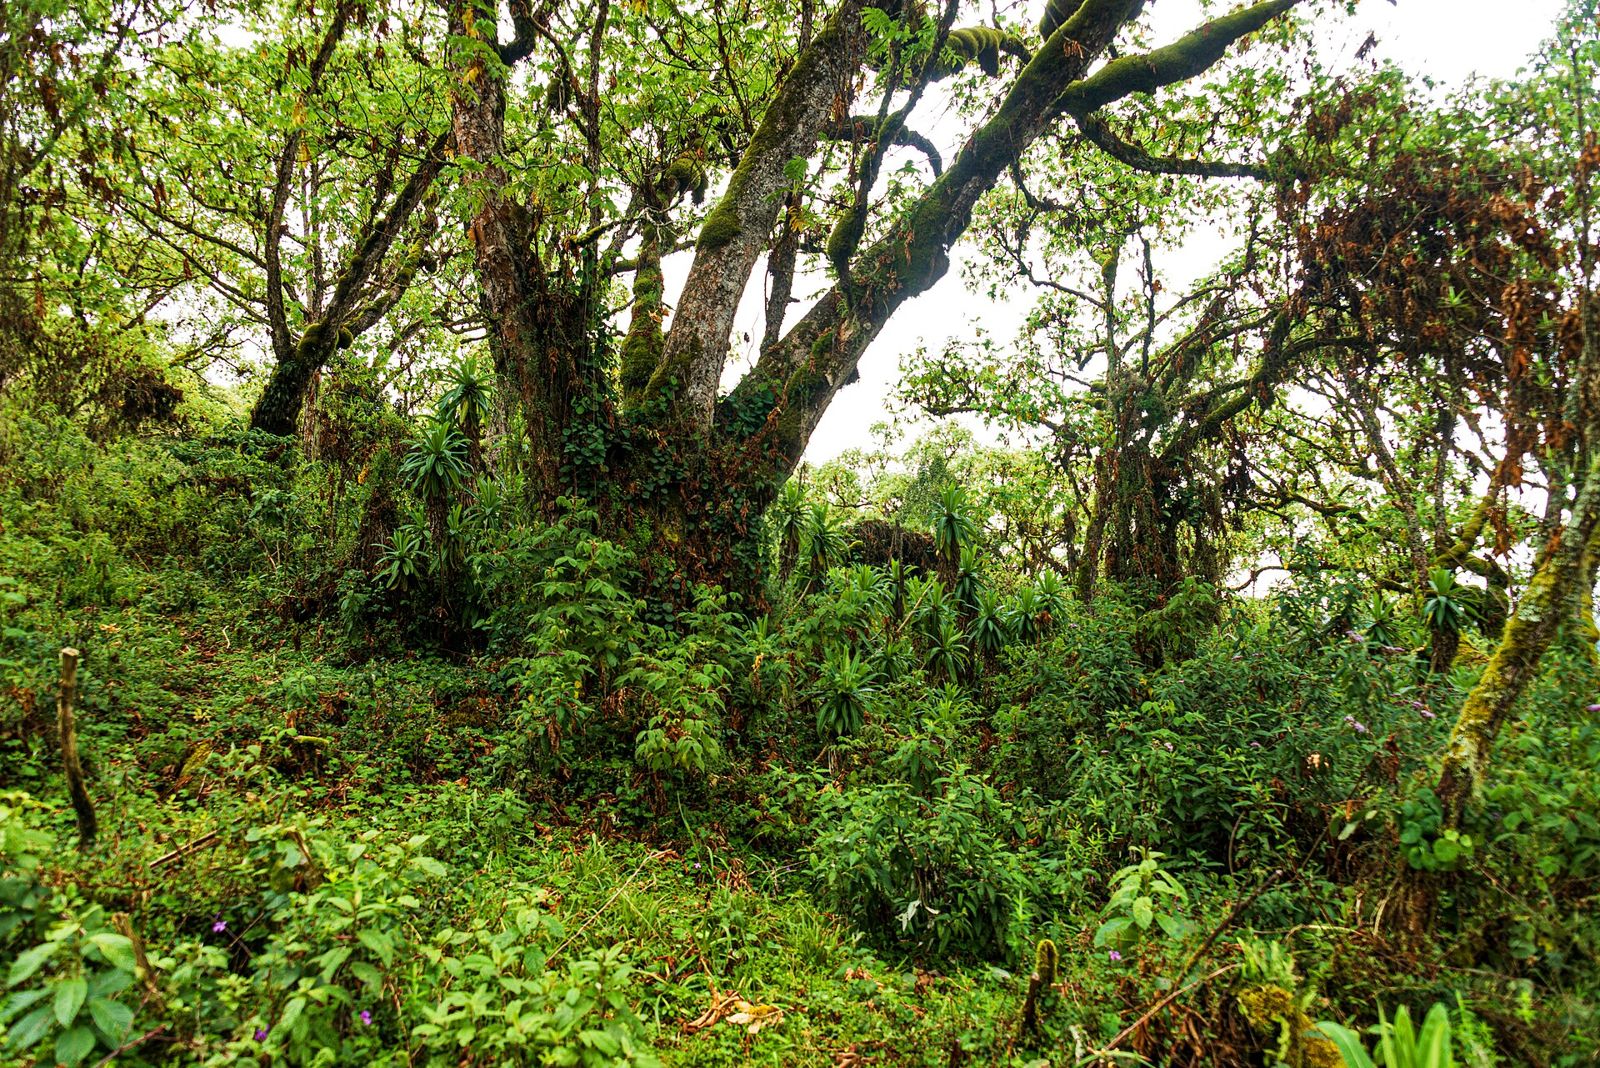
Nyeri
Photo: Daniel Case, CC BY-SA 4.0, via Wikimedia Commons (resized)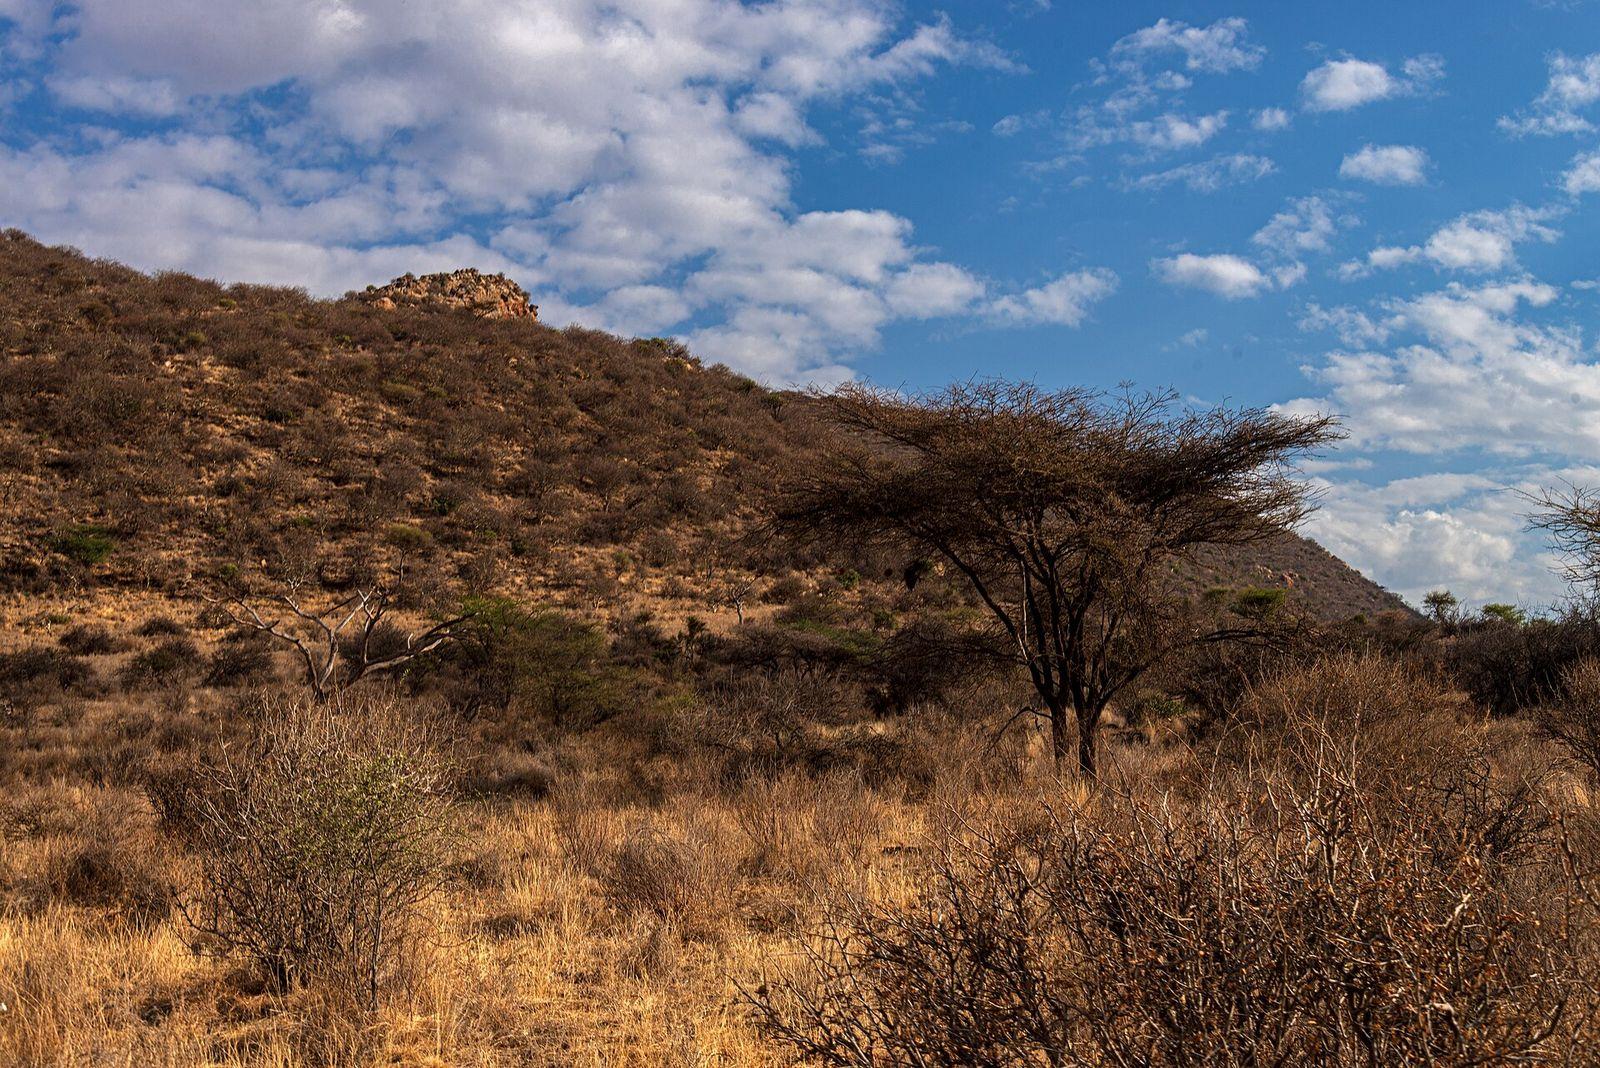
Samburu
Photo: Daniel Case, CC BY-SA 4.0, via Wikimedia Commons (resized)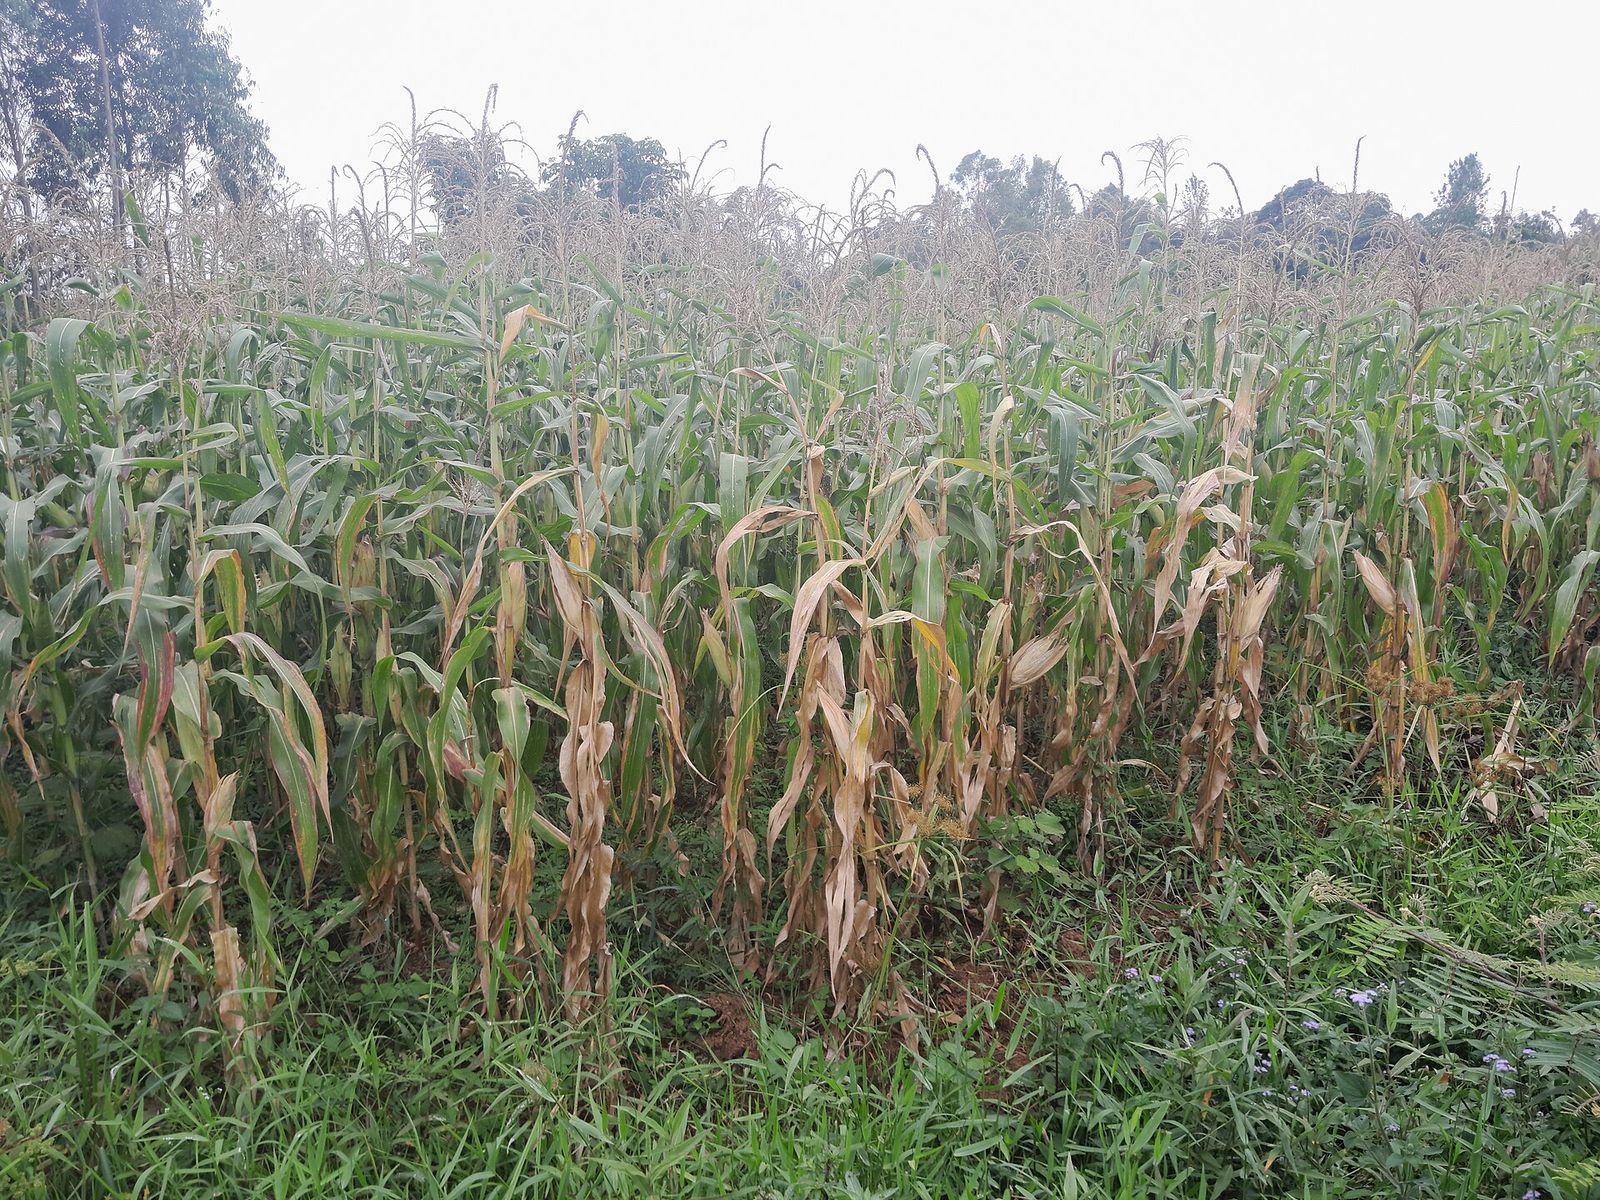
Siaya
Photo: VickyOmondi, CC BY-SA 4.0, via Wikimedia Commons (resized)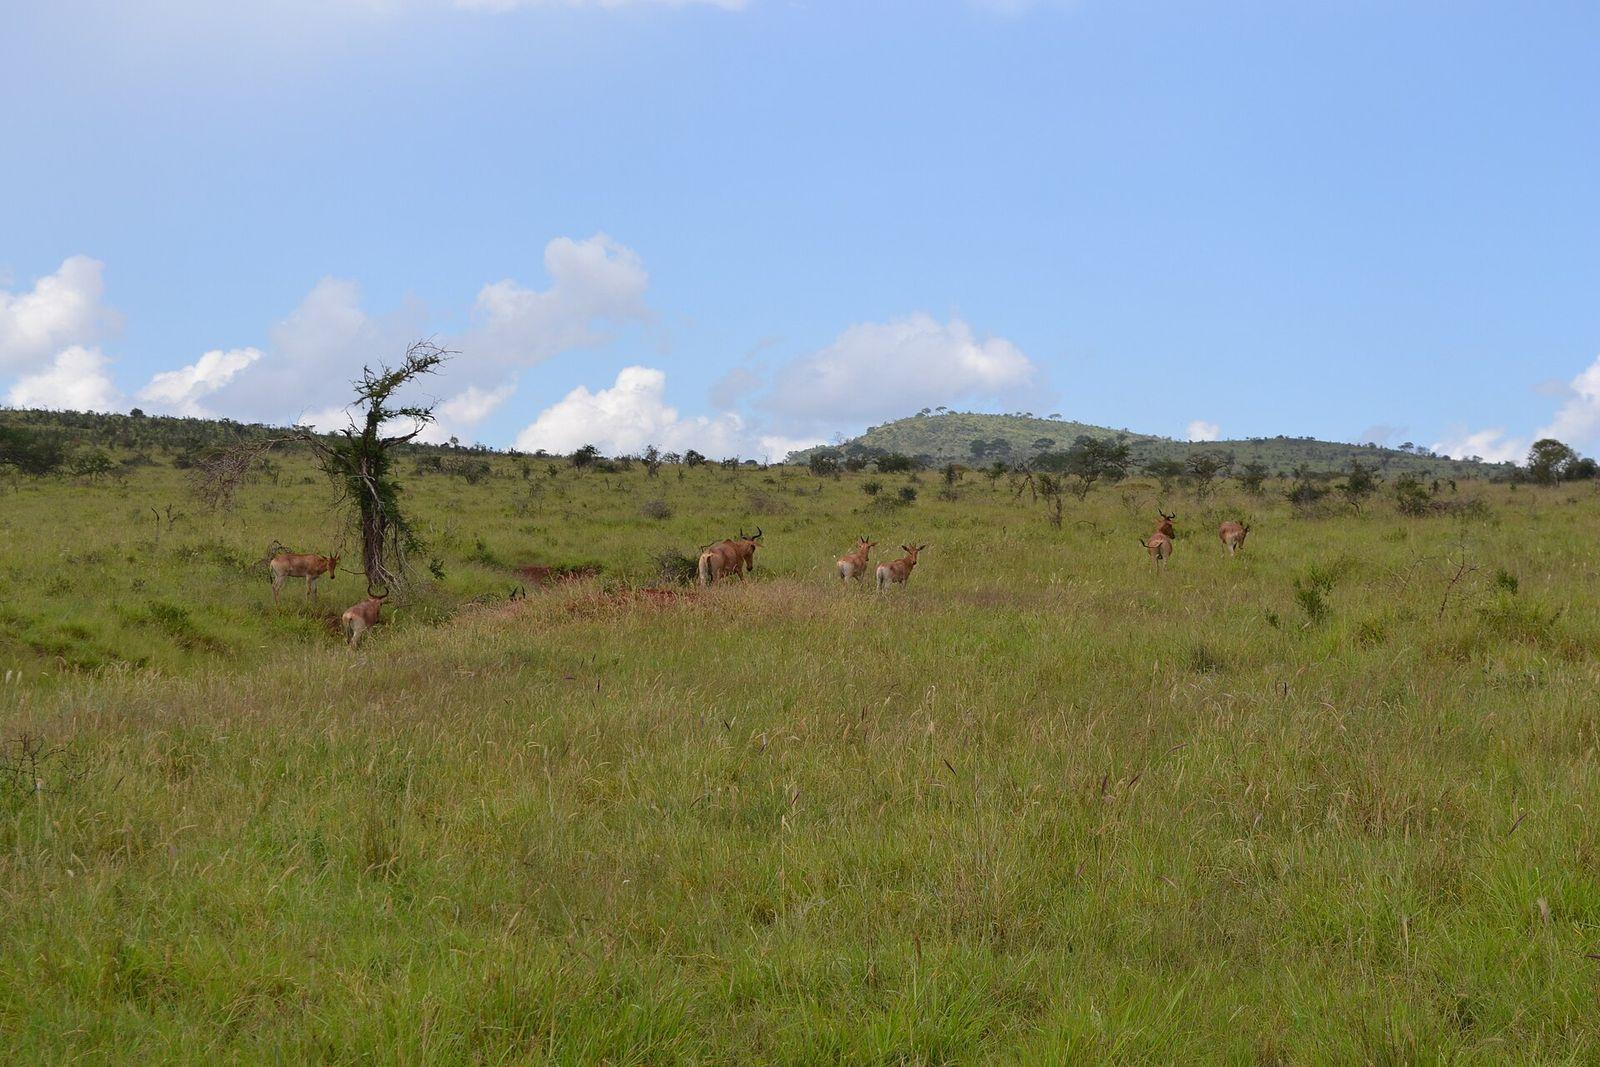
Taita-Taveta
Photo: CT Cooper, CC BY 3.0, via Wikimedia Commons (resized)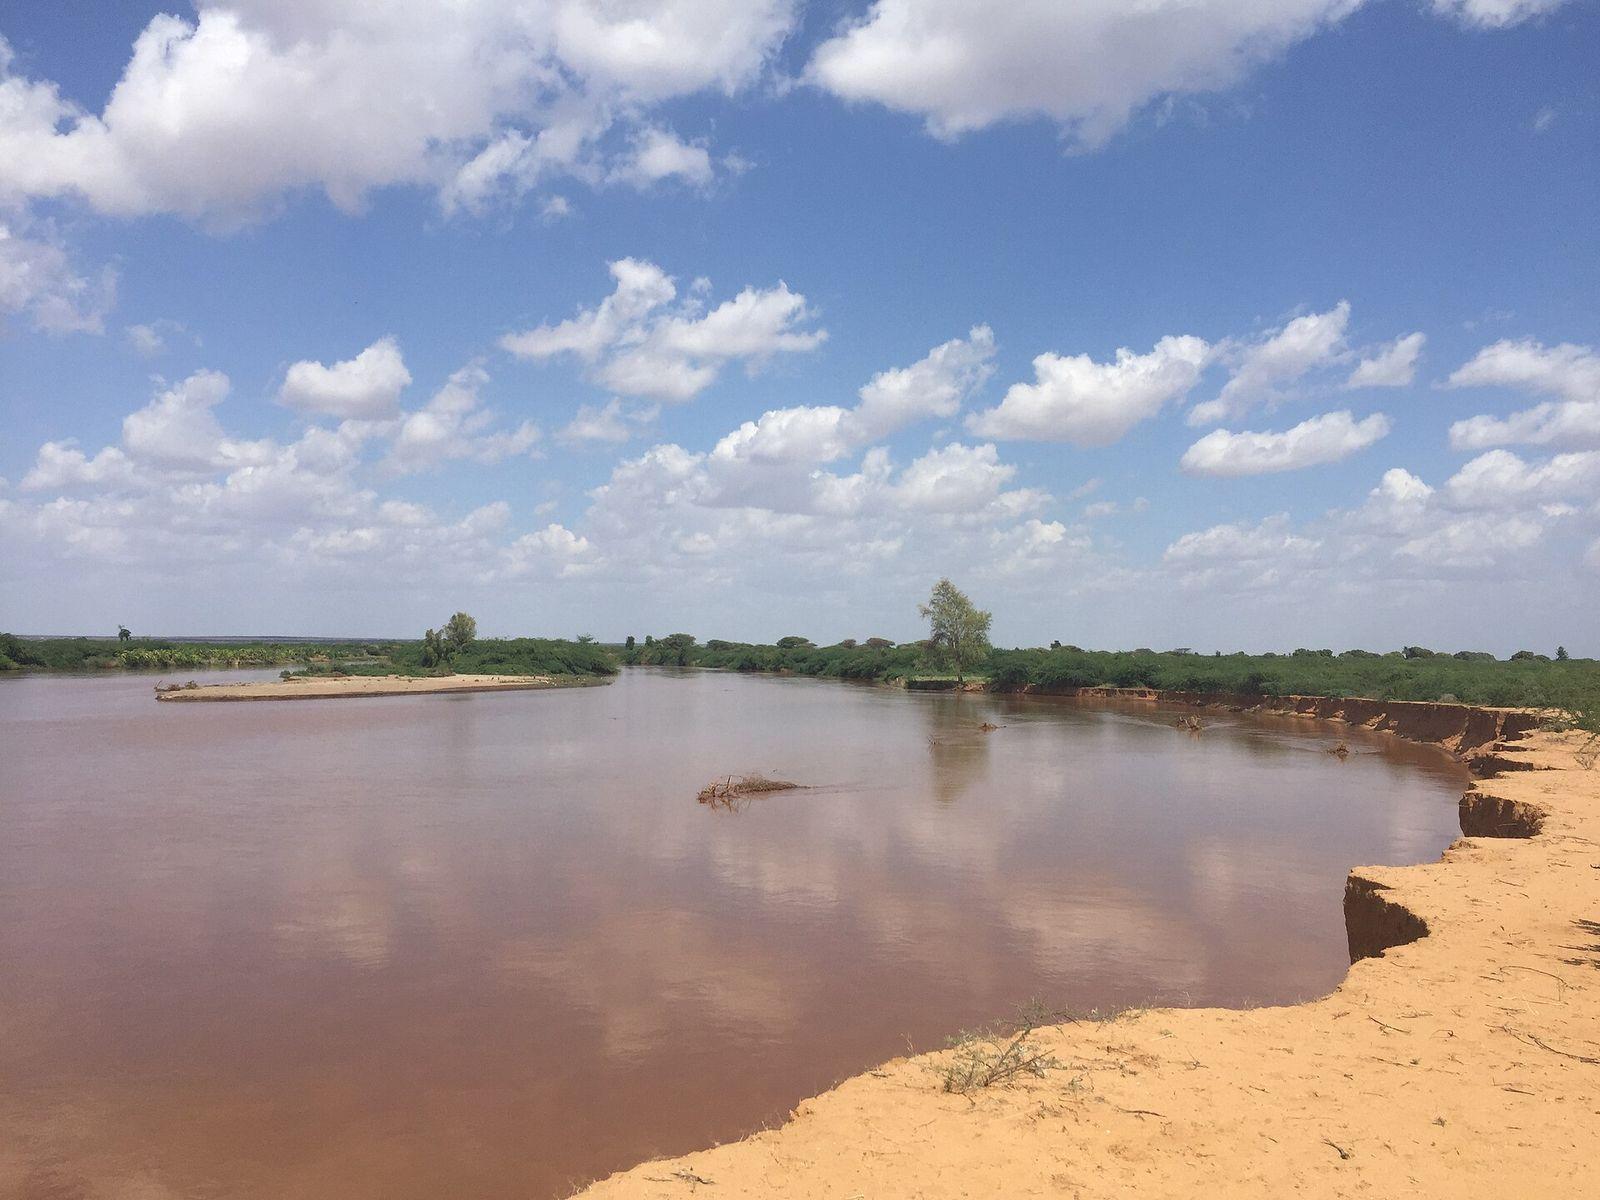
Tana River
Photo: Adam H T Geelle, CC BY 3.0, via Wikimedia Commons (resized)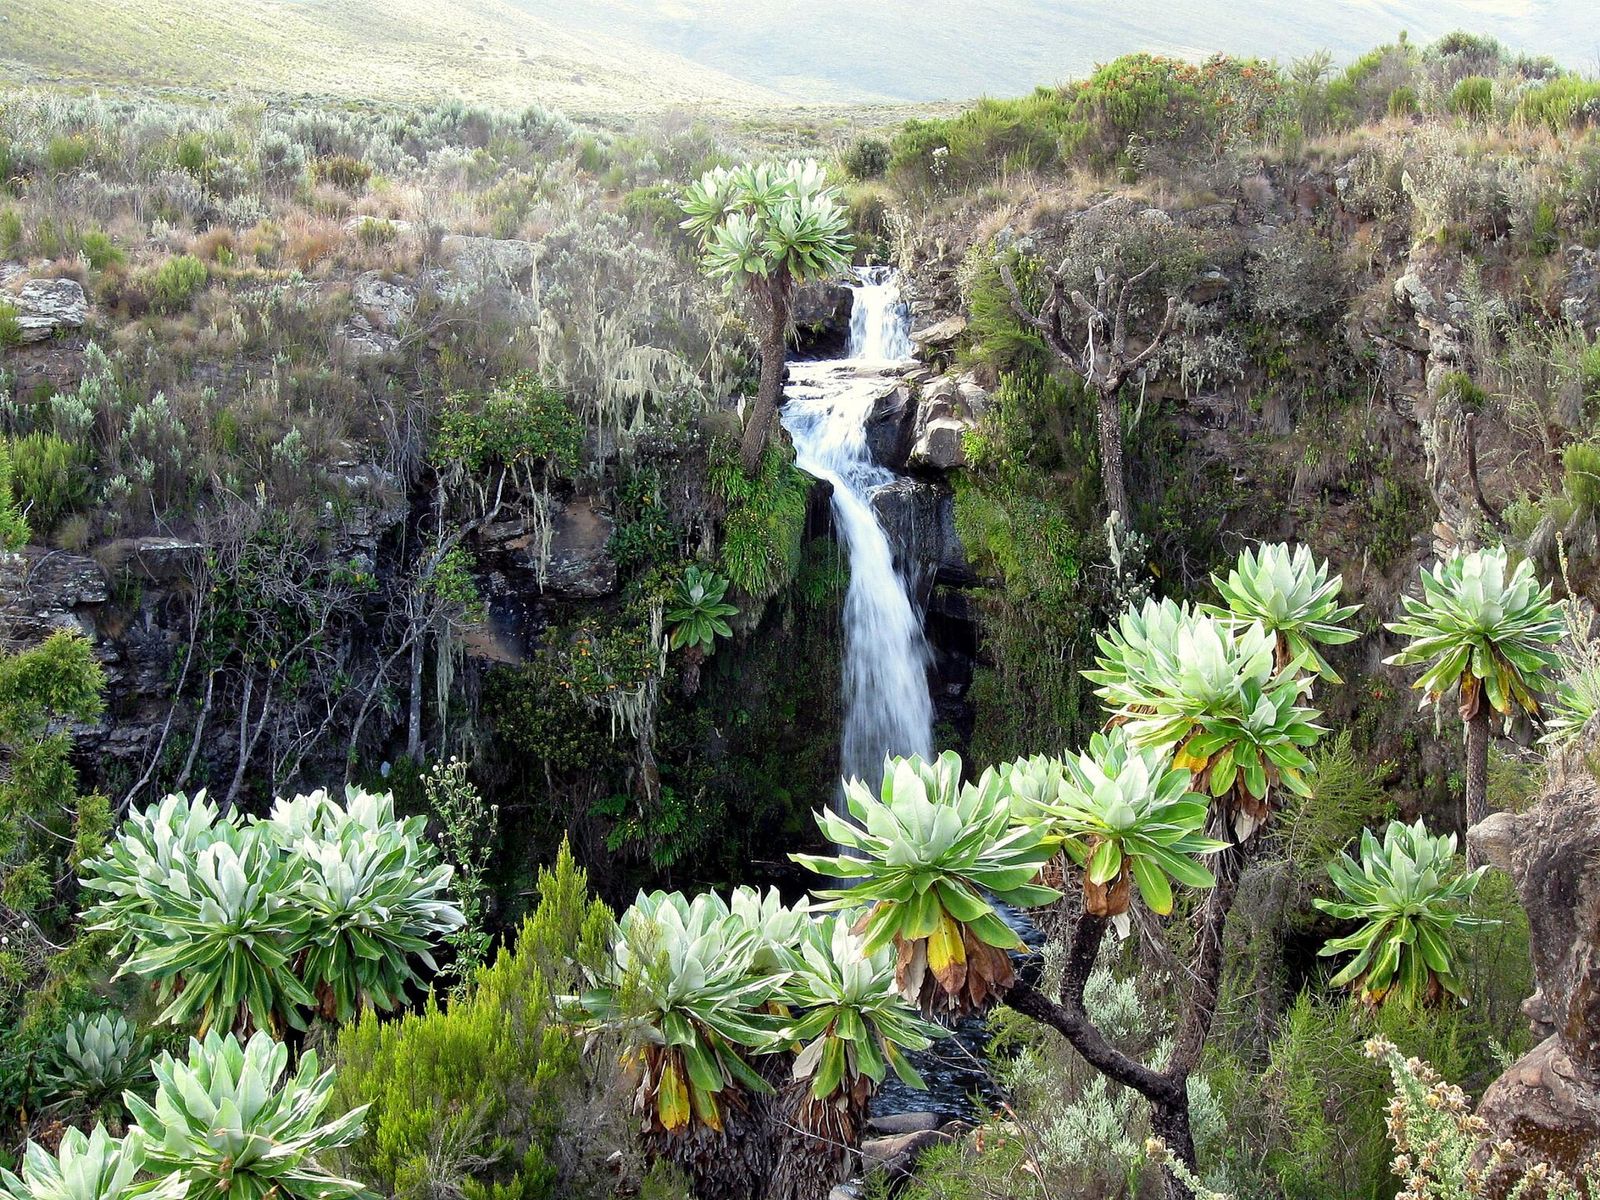
Tharaka-Nithi
Photo: Franco Pecchio, CC BY 2.0, via Wikimedia Commons (resized)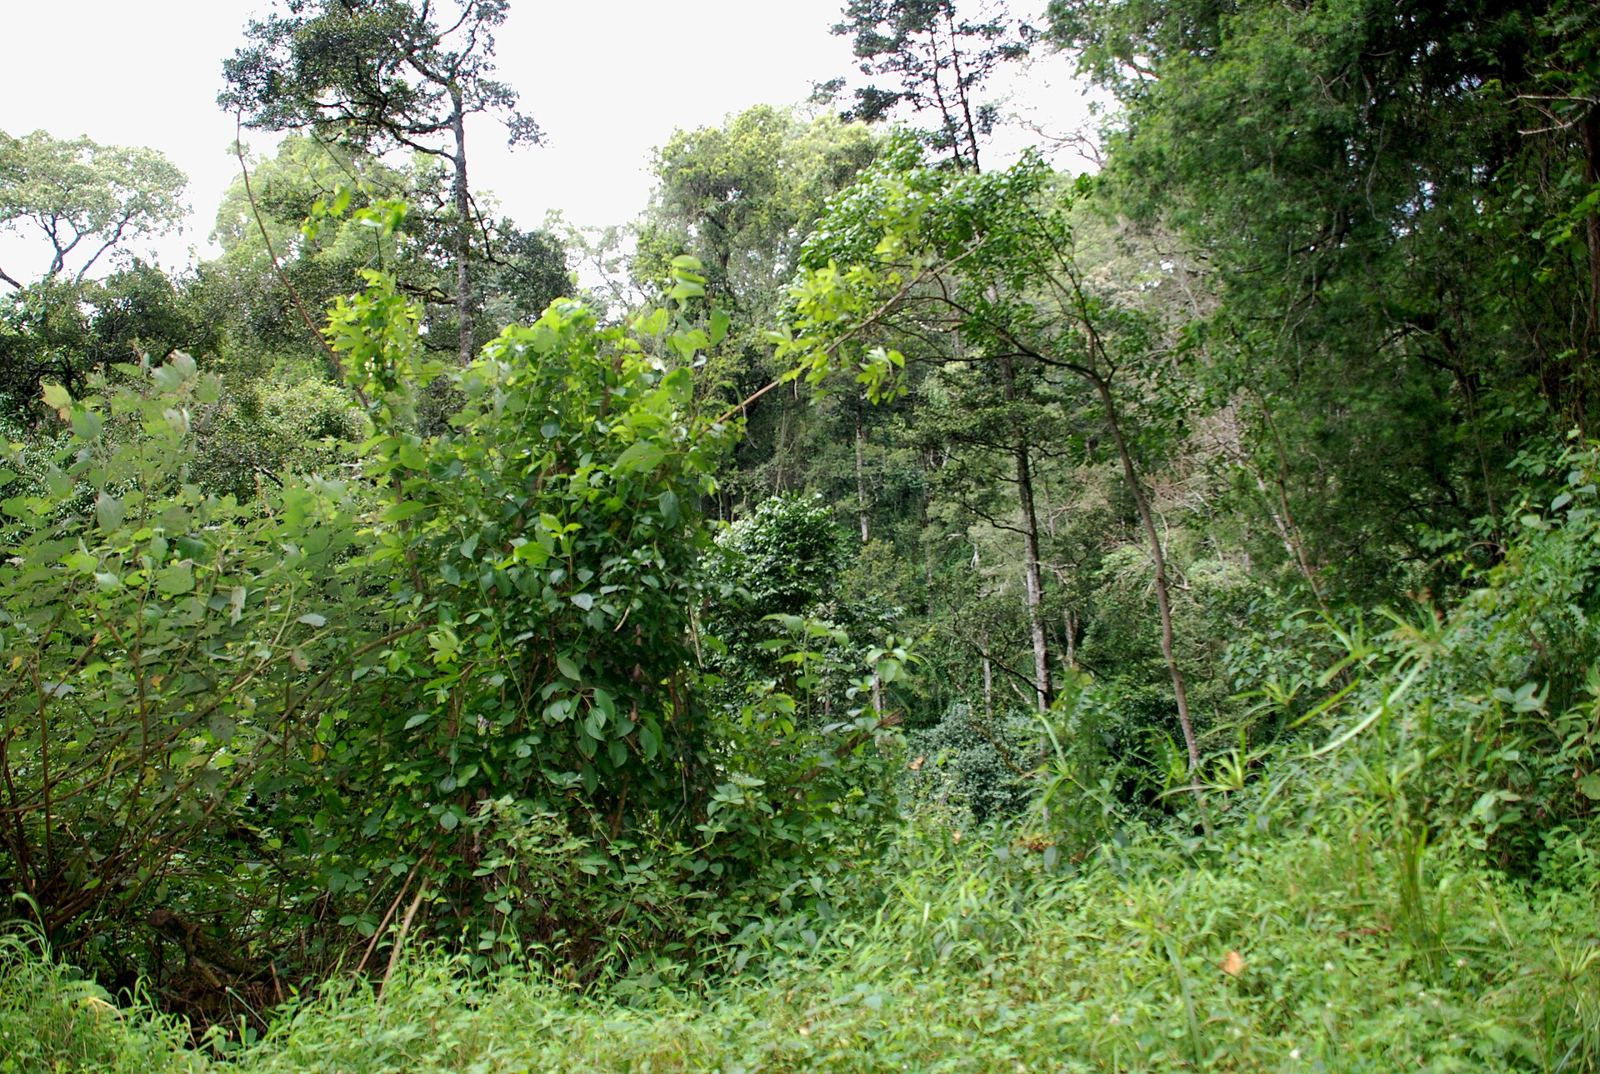
Trans Nzoia
Photo: Josep M. Gracia, CC BY-SA 4.0, via Wikimedia Commons (resized)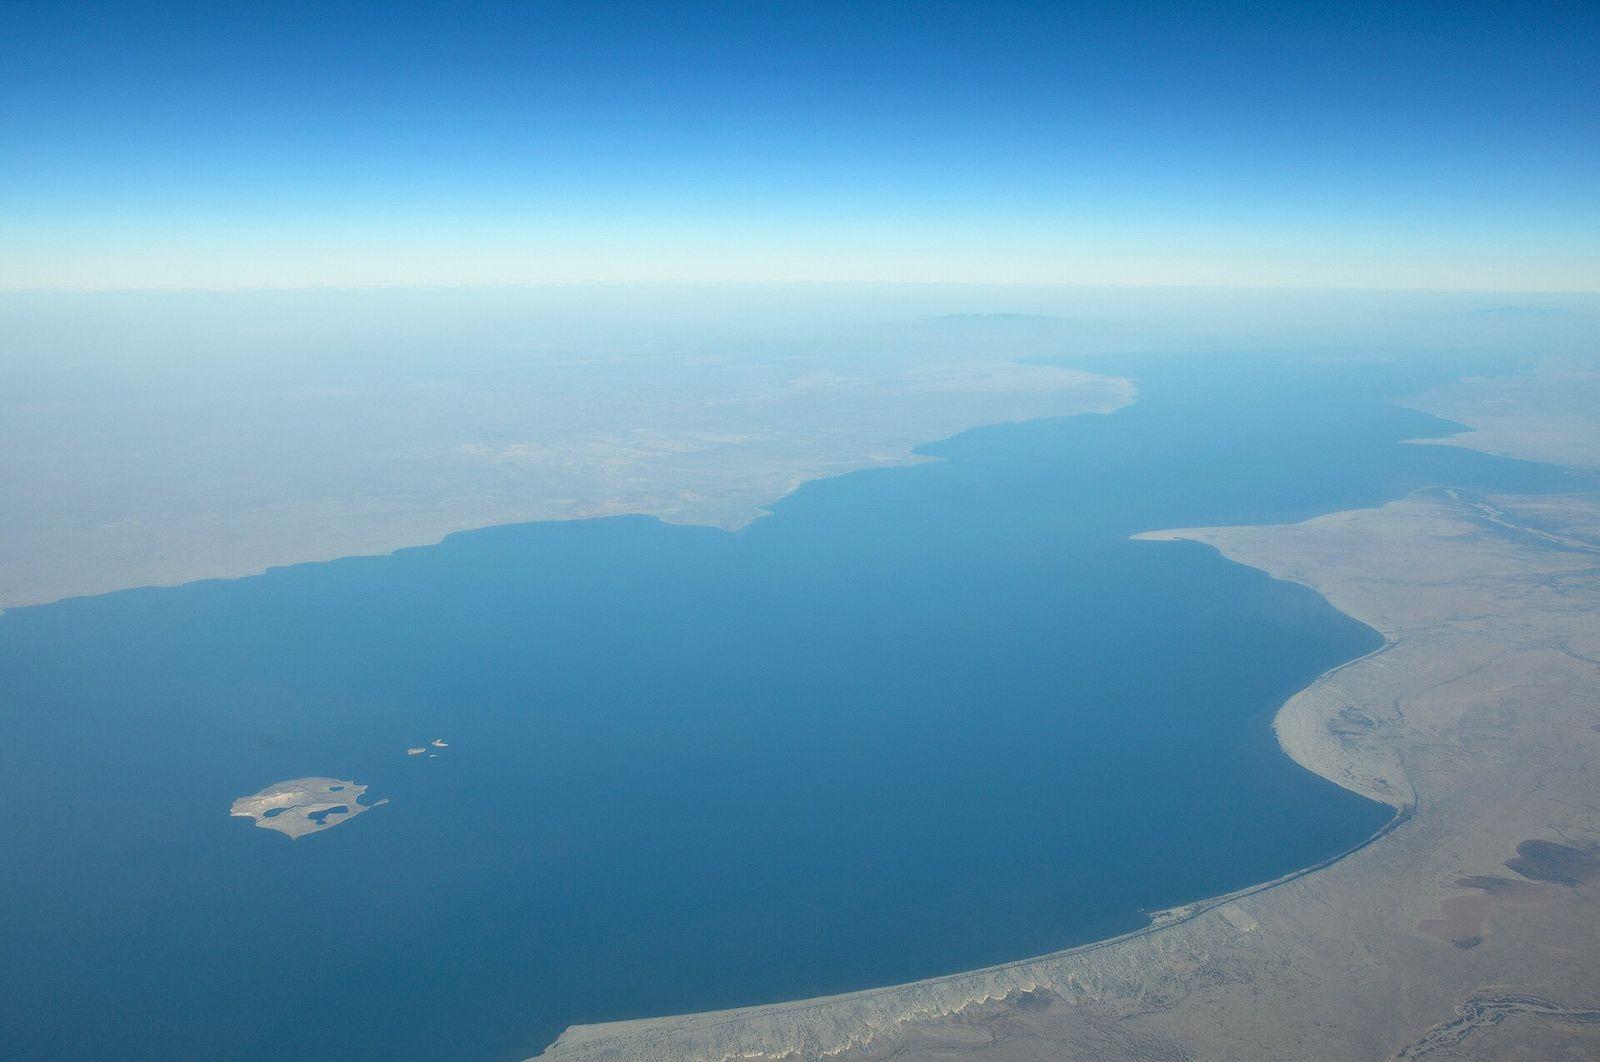
Turkana
Photo: Hansueli Krapf, CC BY-SA 3.0, via Wikimedia Commons (resized)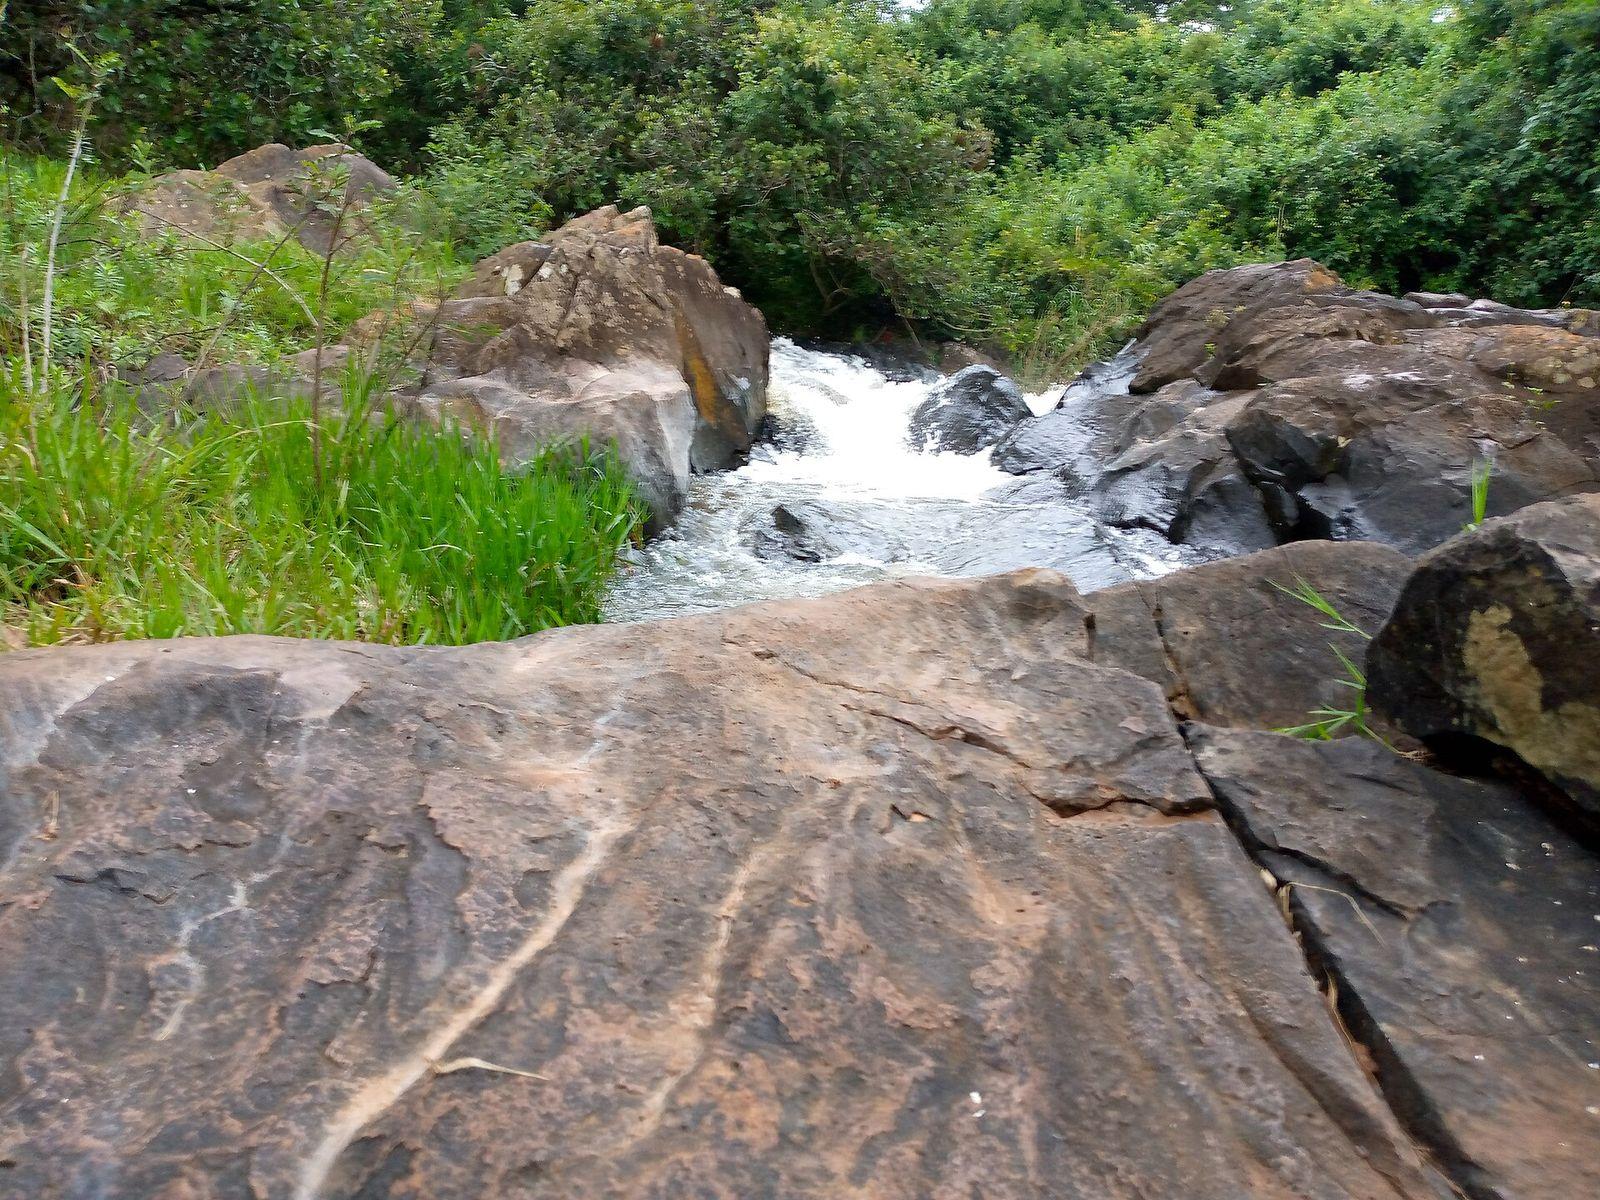
Uasin Gishu
Photo: Muchirik, CC BY-SA 4.0, via Wikimedia Commons (resized)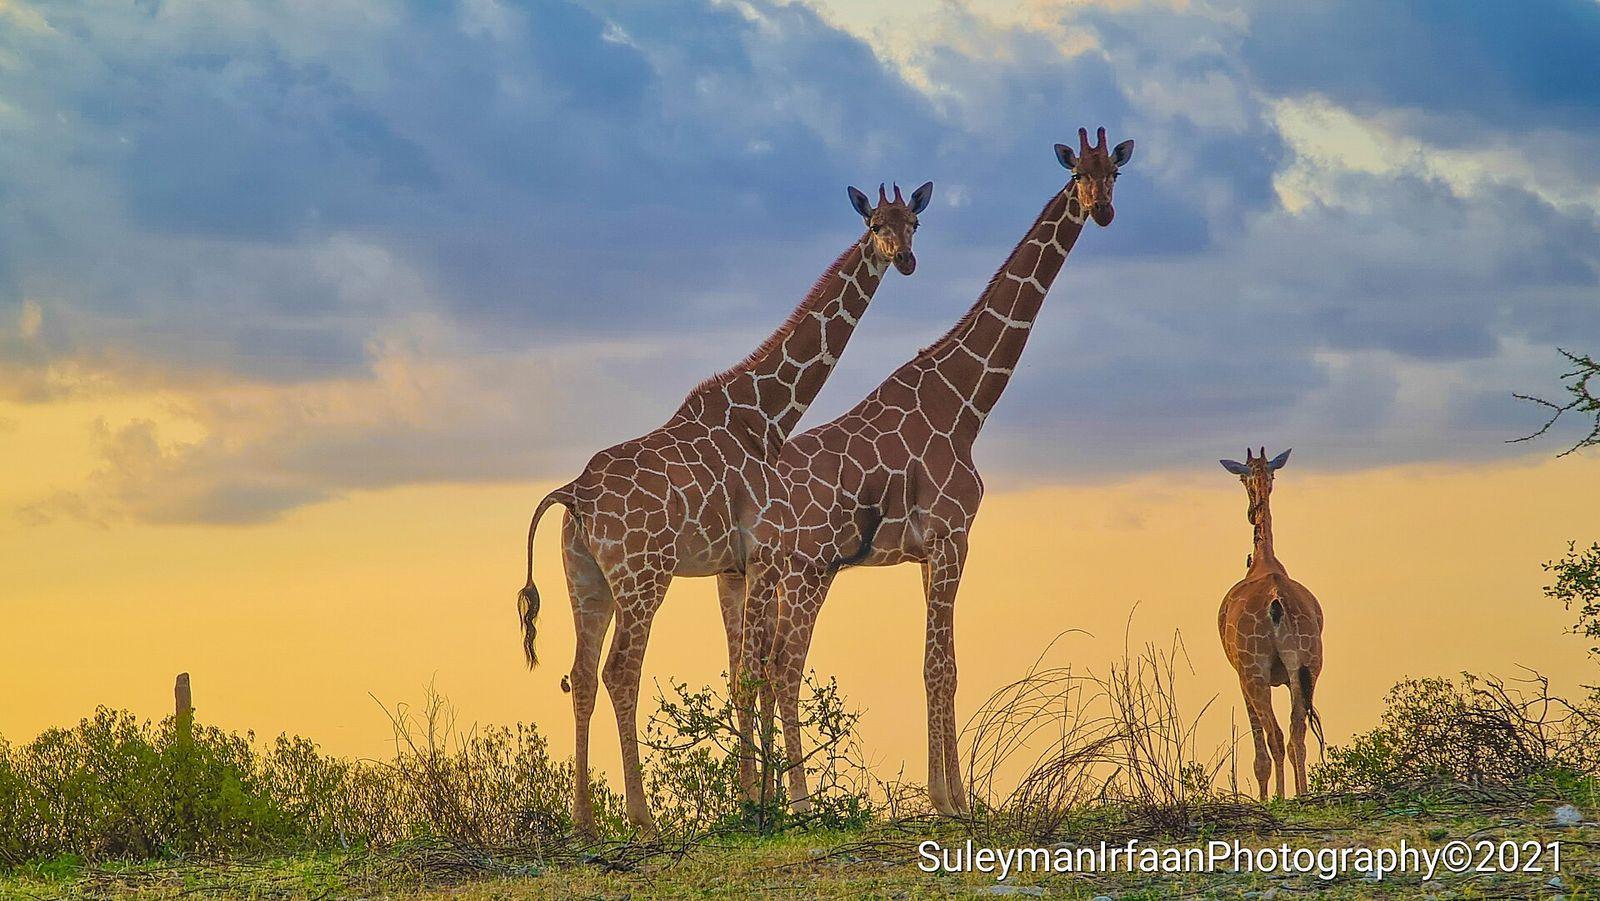
Wajir
Photo: Suleiman Saney, CC BY-SA 4.0, via Wikimedia Commons (resized)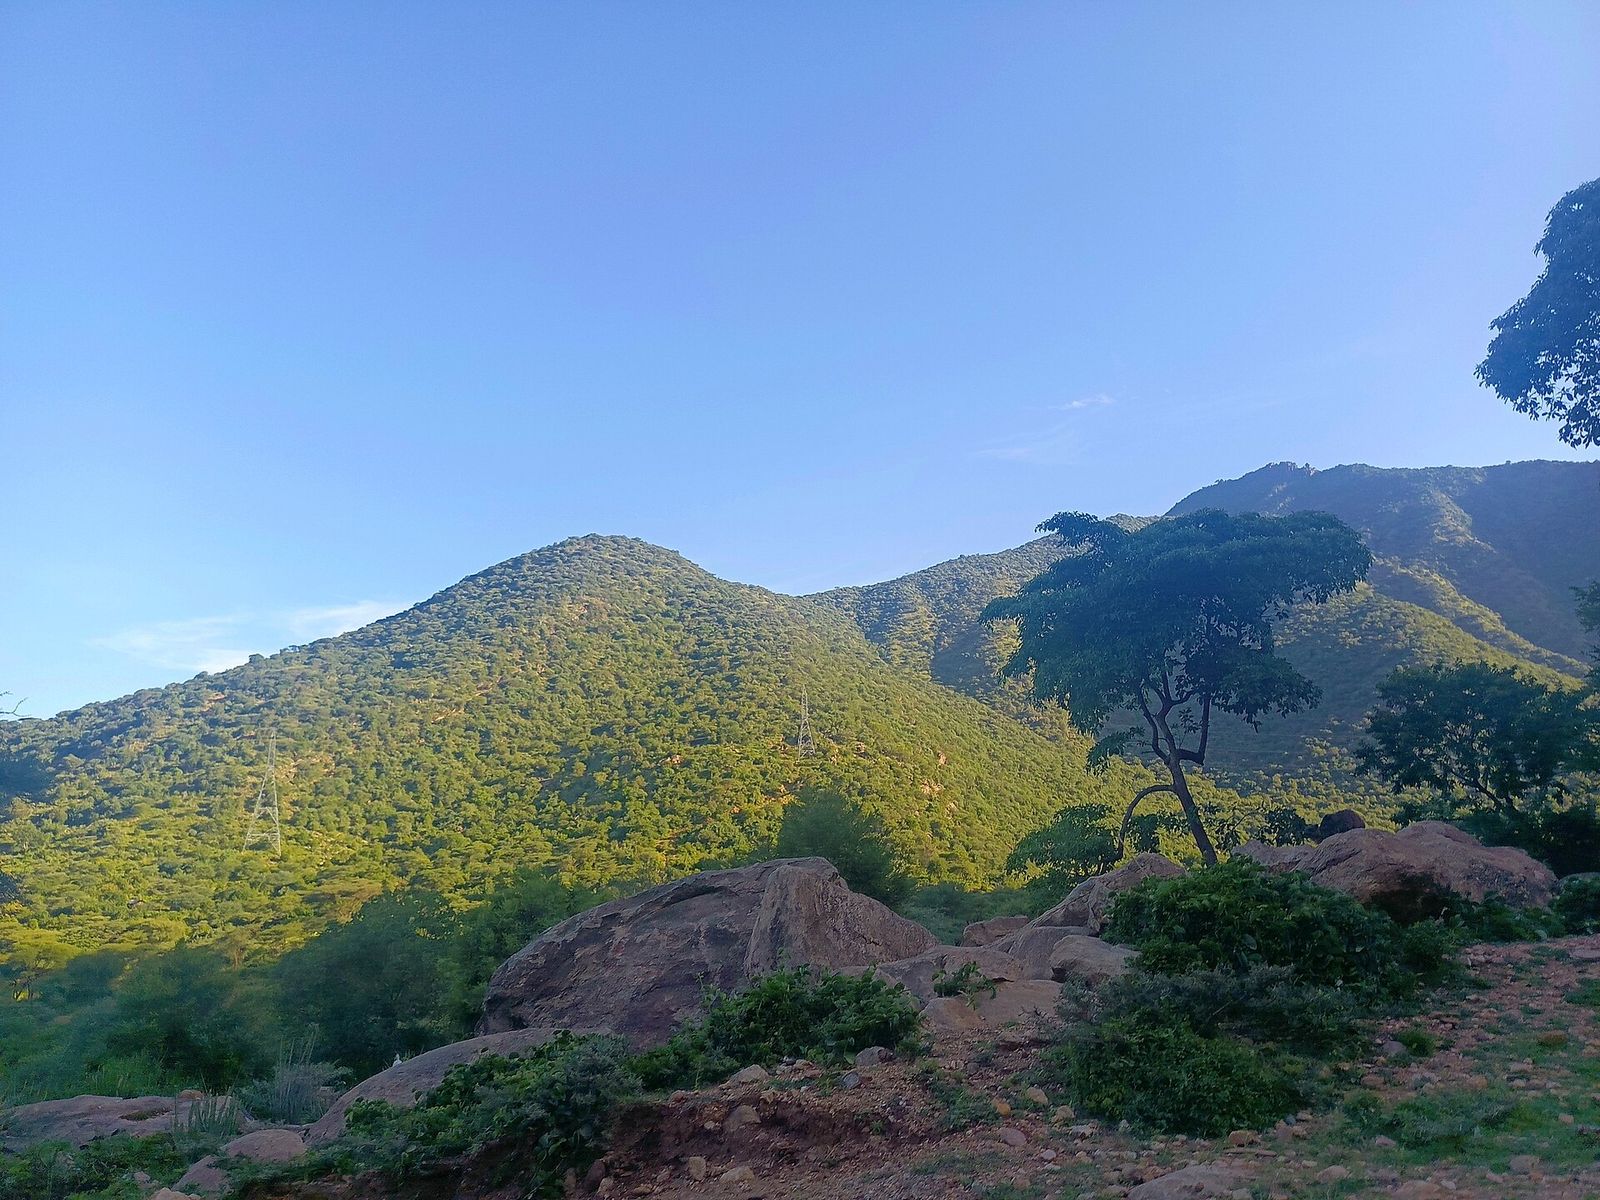
West Pokot
Photo: Tish Madesh, CC0, via Wikimedia Commons (resized)
Carbon here is above-ground only: satellite-estimated biomass × 0.47, trained on the ESA CCI biomass map and checked on land the models never saw (see the validation report). Tree-cover loss is the share of each county with loss recorded in Hansen Global Forest Change.
Checked against the reference map itself (ESA CCI Biomass v7, 2020, same county outlines): the 47 counties together come to within 4% of ESA's total (376.8 vs 389.4 million t C). Single counties vary more - 28 of 47 are within 15% - and the dry north and east are the least certain (Wajir +48%, Samburu −25%), so use a county's own analysis for decisions there.
These are screening estimates for comparing places and targeting work, not verified carbon accounting or credits. One national run at county scale; a county or farm analysed on its own gets a finer map.